Tuesday, September 02, 2008

Emerging search patterns on learning resources

I am hugely inspired by the stuff from J.Feinberg and D.Millen, especially by the studies that they've done on doger, the IBM internal social bookmarking service. I must admit, though, that I had missed on it a bit, I cannot believe! Anyway..

This paper is really interesting, Social bookmarking and exploratory search (2007), not least for the reason that it offers a very interesting, almost similar study design that I am planning on my log files and search pattern analysis on the MELT portal. (Great minds think a like ;p yeah, right..)

The study design is a field study of a social bookmakring service in a large corporate (IBM) with quantitative data (click level analyses of log files and boomarking data) and qualitative data like interviews.

And, this is the data that I collect for my study (Table 1). Quite simlar!

They use a categorisation of search that I will adapt to my usage:
  • Community browsing (Examining bookmarks created by the community. In my case these could be lists of most boomarked items, travel well; tags; other people Favourites)
  • Personal search (Looking for bookmarks from one's own personal collecction of bookmarks)
  • Explicit search (Explicit search using traditional search box)
A few days ago I looked at the first logs from Melt. Here is the run-down. I have not used the same types of searches, but I will explore them for the later usage. But basically what you can see:

There were 512 search events:
  • 41% Explicit searches (adv. search)
  • 34% Community browsing (tagcloud)
  • 25% browsing categories
What was called "click-through" in this paper is when the particular navigation path resulted in a page view. This is what I call view resources. We can see that there were 538 page views, which implies that most likely users have clicked on more than one resource as a result of a search.
  • 74% of resources were viewed in search result list (srl), this means that they were results from advanced search and browsing categories

  • 20% of resources were viewed as a result of community browsing (e.g. tagcloud, lists)

  • 5% of of resources were viewed as a result of personal search (e.g. in Favourites)

How many searches resulted in viewing resources? I have to verify this
  • 85% of explicit searches and browsing categories
  • 65% of Community browsing (tag cloud and lists)
Millen et al. 2007 speculate that in their study, the a higher click-through rate indicates a more purposeful searching, whereas the community browsing was used more as an exploratrory search activity. I will need to keep my attention on this and whether I can make similar conclusions.

Most likely, anyway, I do not use click-through as an indication of intenet of using a learning resources, what I find most interesting in my study will be how many of the search activities result in a bookmark and/or rating. That is much cooler in my mind than viewing the page. Actually, I've noticed that in our system users view resources a lot, but they do not necessarily show any further interest on them.

That is why I use both implicit and explicit Interest Indicators. By Interest Indicators I mean Explicit Interest Indicators like ratings as a subjective relevance judgment on a given learning content, Marking Interest Indicators like bookmarks and tags on educational content, and Navigational Interest Indicators such as time spent on evaluating the metadata of educational resources, as well as Repetition Interest Indicators as categorised by Claypool, et al., 2001.

In this small study we can see that 19% of viewed resources ended up in users' Favourites. Again, ratings were much less, only about 6% of viewed resources ended up being rated. In the study from IBM system, they had 34-39% as high click-through. Will be keeping my eye on that.

My advisor asked me whether I could find search patterns in my logs. I think I could. In this paper (Millen et al. 2007) they do that :) and here is how: "Looking for Patterns using Cluster Analysis"
To better see the patterns of use, we performed a cluster analysis (K-means) for the different types of search activities. We first normalized the use data for each end-user by computing the percentage of each search type (i.e., community, person, topic, personal, and explicit search). The K- means cluster analysis is then performed, which finds related groups of users with
similar distributions of the five search activities. The resulting cluster solution, shown in Table 4, shows the average percentage of item type for each of four easily interpretable clusters.
Should not be too hard :)

Millen, D., Yang, M., Whittaker, S., Feinberg, J., Social bookmarking and exploratory search (2007). In L. Bannon, I. Wagner, C. Gutwin, R. Harper, and K. Schmidt (eds.).
ECSCW’07: Proceedings of the Tenth European Conference on Computer Supported Cooperative. Work, 24-28 September 2007, Limerick, Ireland

Activity Theory helping us explain folksonomies

I've been lately reading Engeström's (1) stuff and about Activity Theory. In this paper (2) I found a cool reference that explains how using Activity Theory as a theoretical framework we can study learning resource repositories (LOR) and their communities as one single system rather than as a loose set of instruments, subject, objects and outcomes.

I think that is a very important point. I've been arguing for quite a while that tags and social bookmarking can be revolutionary for LOR because now we can make a connection between the user, the resource and its metadata.

Before, it was only the resource and metadata, and a scary looking form for searching the resources (this is time before Google's simple search box, right?). Now, if implemented correctly, social bookmarking and tagging not only helps individuals with their resources management (e.g. Favourites), but also helps other folks to find resources through other users and their digital traces such as tags, number of bookmarks, etc.

To understand Activity Theory it is important to get the bases: everything, well, everything within human activity, is based on the three dominant aspects which are production, distribution and exchange (or communication).
The model suggest the possibility of analyzing a multitude of relations within the triangular structure of activity. However, the essential task is always to grasp the systemic whole, not just separate connections. (no page number in my print, just below Figure 2.6).

This is also the base for the analysis in Margaryan & Littlejohn (2008) for the learning resource repositories as instrument, with rules, division of labour, outcomes, etc.

Moreover, Engström emphasises that there is no activity without the component of production.
The specificity of human activity is that it yields more than what goes into the immediate reproduction of the subjects of productions. One part of this "more" is the surplus product that leads to sharing and sociality, discussed by Leakey & Lewin and Ruben above...(found on the next page)

I was thinking of folksonomies and how the production of tags is first of all good for me. People often times tag and bookmark to "keep found things found", it's part of personal knowledge management activity. Similarly like above, when referred to, for example, production of food that leads to sharing and sociality, in tags, the fact that they are made available to all, leads to sharing and sociality.

I thought that was pretty neat.

Ideas for the design of the "Evidence" study on cross-border use of learning resources

"Psychological tools" helping us explain "Travel well" resources

In the chapter 2, in the subsection called The Third Lineage: From Vygotsky to Leont'ev Engström (1) talks how Vygotsky distinguished between two interrelated types of mediating instruments in human activity: tools and signs. The latter belonged to the broader category of "psychological tools".

Psychological tools
..are directed towards the mastery or control of behavioral processes - someone else's or one's own - just as technical means are directed towards the control of processes of nature. (I guess this is from the same source as the quote above this, this is Vygotsky 1978, 55)
Examples of psychological tools:
various systems for counting; mnemonic techniques; algebraic symbol systems; works of art; writing; schemes, diagrams, maps, and technical drawings; all sorts of conventional signs, and so on. (Vygotsky, 1982:137, cited in Cole & Wertsch)
...and folksonomies :)

I was thinking that the concept of psychological tools is a pretty cool way to start looking into the cross-border use of digital learning resources. My definition is: By cross-border use of digital resources we mean that the user comes from a different country than the resource (cross-country) and/or the resource is in a different language than that of the user’s mother tongue (cross-language).

Many people are baffled about the cross-border use, they always ask me "..but how would teachers be able to make any use of a resource that is in a language that they don't understand".

Let me first elaborate on different types of use of cross-border resources, and then I give my theory on it. The plan is to make a study to see whether this holds or not.

We had a workshop with 35 teachers in science and language learning from different European countries. We asked them to bring along a learning resource that they though would be useful for other teachers in other countries. The observations were the following:

1. Resources that contain psychological tools: examples of this type of resources were in science, biology and math. Here are some examples of the characteristics of these resources
  • How chromosomes define characteristics (e.g. eye color, color of rabbit) or how the human heart works (we actually had examples of this in 2 different languages!).
    If you know the concept (as this would be part of the acquired knowledge of a teacher) you can explain it using this type of examples. It's not important that the manipulations are not in their own language, as the user interface is pretty symbolic and self-explanatory. Also, the little texts in other language did not seem to bother teachers.

  • DNA and how it works, another one on chemistry. The intersting thing is that the text is in Estonian and the resource was intended for pupils, but the group of teachers agreed that they would find it useful as a tool to demonstrate the concept by themselves (note: different intended user group). They explained that they would manipulate the resource for demonstrational purposes, not let the pupils to use it.

  • GeoGebra was one of the examples of a math application. They all loved it! Most importantly, it can be translated easily and it has user communities in different languages.
    Besides those points, they said that as math symbols are commonly shared, it is easy even in other languages. Even this type of applet would be useful for a non-Spanish speaker. BTW, they hated when some resources did not use the proper symbols, but wrote out "tiempo"
2. Resources with more text in a foreign language. One could also observe that some teachers were not minding too much about the text in foreign languages, but they used their pedagogical skills to work that into a challenge to learn.
  • One example from another workshop was a history resource about Greco-Persian war. Although this was already harder to navigate in Polish, a Belgian teacher started coming up with ideas where learners have to solve the language as a challenge. An example was given about a "match the words with an image"-type an exercise about the war equipment of a Greek solder.

  • Another innovative usage was this Japanese virtual reality game, where users have to find their way out of the virtual room with a help of a team. This Hungarian teacher had given it as an English exercise for his students to solve as a group and write down the instructions in English. He said that students were completing the exercise on Friday evening working online with their buddies!
3. Resources that are in the languages that the user has competencies in. This is of course the most used case. If you have studies Russian, for example, you can use resources in that language.

4. Language teachers. This is a group a bit apart too. They, of course, find the whole Internet as their resource for learning! But also the language resources that are created, say, in Finland to study Way finding in French, can be useful in any other language teacher somewhere else. Here the important thing is to make the instructions also in the language that is being taught, so that teachers understand (of course best is making interfaces easy enough without any instructions needed)

So, my theory is that the use of cross-border resources plays on a continuum that has two quite distinct extremes: On the one end we have psychological tools (example 1 and 2) and on the other Foreign language as a tool (example 3 and 4).

The acceptance or willingness of using this kind of material is related to the teacher's previous knowledge and understanding on the topic on the one hand, and on the other, it can be the knowledge or previous experience on coping with foreign languages. Additionally, the pedagogical skills set and pedagogical concepts that are preferred by that teacher drive the final decision on using such material.

A study design

In my study of "Finding evidence" I will only focus on the continuum of psychological tools and foreign language skills. I have a huge dataset from at least 3 or 4 different learning resource environments where users (teachers) have bookmarked or made collections of learning resources that exist in multiple languages.

The dataset currently has 440 users who have selected at least one learning resource to bookmark or add into their collection.
  • Calibrate (176 users, number of posts=1742)
  • LeMill (189 users, number of posts 1645, out of which 238 cross-border actions)
  • del.icio.us (16 users, number of posts 1176).
  • MELT
When I look at the titles of these learning resources, there are 3700 of them. 2992 of these resources have been bookmarked only once. The idea is to sort out cross-border resources (using my definition above), and see whether I can classify them on my continuum.

The good thing is that I know the user languages and country of origin in all the cases, the bad this is that I do not know the country of origin or language of all the resources :( That seems like lots of resources starring.


1 Engeström, Y.: Learning by expanding: An activity theoretical approach to developmental research. Helsinki: Orienta-Konsultit Oy (1987) Retrieved August 25, 2008, from http://lchc.ucsd.edu/MCA/Paper/Engestrom/expanding/toc.htm


2 Margaryan, A., & Littlejohn, A.: Repositories and communities at cross-
purposes: Issues in sharing and reuse of digital learning resources. Journal of
Computer Assisted Learning (JCAL), 24(4), 333-347 (2008)

Monday, August 25, 2008

Notes on Margaryan, Littlejohn and Activity Theory as a framework

Margaryan and Littlejohn (2007, 2008) analysed the mismatches in the perception of repository curators and users. One of the issues really hit home for me:

The curators focus on repository centric factors, while users spotlight a wide range of contextual factors.
They explain this as following: Repositories are frequently introduced to users as sandalone tools. Users, however, see them only as one component within an entire activity system. They recommend that curators and users have to think through the ways in which individual components inter-relate.

This is what I actually realised this summer when we were at the summer school with MELT teachers. At the point where our system failed to work, teachers did not loose too much time but started checking their delicious accounts and bookmarking some interesting learning resources there that had been introduced earlier during the day. That moment, somehow, was an awakening moment for me. I realised that what I've been hassling about for so long, our dear repository, the one and only, is not really one and only source of information for them. Just one among many others that we are not even interested about.

Hence the little idea of integrating users delicous tags and bookmarks on the MELT portal. A logical place for them would be at the Favourites' section: here, on the first tap, are my bookmarks from MELT, and over here on the second tap, are my bookmarks from delicious too. Cool,ugh, inter-relating the services that teachers use. Also, since by default all my Favourites in MELT are publicly available to other users, so would my delicious bookmarks be.

The whole idea goes much further to integrating these using APML to create a profiling tag cloud from my tags from both places. The workshop paper is found here, I still need to work on it a bit.

Other interesting things about the papers:

The study was build using the Activity Theory from Engström 1987 as a theoretical framework. It also might be interesting for me, as I am missing one. Margaryan and Littlejohn (2007, 2008) claim that it offers a holistic framework that allows to study LORs and communities as a single system, rather than as a loose set of instruments, subject, objects and outcomes. It provides an analytic lens to understand the complex relationships wihin each system.

Activity Theory as such belongs to the family of socio-cultural approaches to learning (e.g. Vygotsky), situated learning theoris (Lave) and communities of practice approaches to learning (Wenger, there he is again..). The paper explains that the common denominator for socio-cultural theories is the importance of social and cultural contexts in learning.

From that perspective Activity Theory might make a nice match. One thing why I first was skeptical about it was that Margaryan and Littlejohn in (2007) say this theory offers a method of analysing the development of LORs as participatory environment where knowledge is co-constructed rather than "exchanged" or "consumed". I am not sure whether LORs really were developed in thinking of co-construction of knowledge, at least not before we mixed in the social tagging stuff. From that point, then, it becomes interesting, maybe.

In Margaryan and Littlejohn (2008) authors also talk about how social co-creation of knowledge is facilitated through the use of tools, either concepetual or physical. A dialogue can be such a conceptual tool, but so can email or blogs. Also tags, I guess, can subscribe to that.
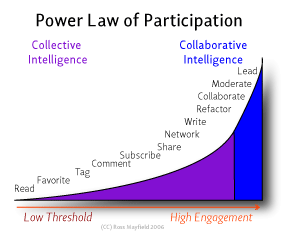
Another thought that came out from reading the 2008 journal paper was that it also talked about Leontiev (1981) and analysing an activity from 3 different levels. The first level related to the overall motive for engaging with an activity. The second level relates to the actions that constitute an activity that are governed by (short-term) goals. The third level of activity related to the operations necessary for carrying out the actions. This made me think of "levels of participation" like in this ladder (or the long tail one). What they also try to depict is that there are different levels of participation, they are differently motivated, and maybe when talking about learning, we can also observe similar levels as pointed out by Leontiev (1981).

A few ideas for the evidence finding paper:
  • The dimensions of repositories and communities can be used to describe the datasets that I will use
Start for the evidence paper: Assume that repositories and learning resources get rid of technical, socio-cultural and pedagogical barriers for usage (references from the JISC report on Learning Communities and Repositories from CD-LOR project), does the re-use across the national and linguistic borders happen? If evidence is found, how much and where?

Engestroem, Y. (1987). Learning by expanding: An activity theoretical approach to developmental rsearch. Helsinki: Orienta-Konsultit Oy. Retrieved August 25, 2008, from
http://lchc.ucsd.edu/MCA/Paper/Engestrom/expanding/toc.htm

Margaryan, A., & Littlejohn, A. (2008). Repositories and communities at cross-purposes: Issues in sharing and reuse of digital learning resources. Journal of Computer Assisted Learning (JCAL), 24(4), 333-347.

Margaryan, A., Littlejohn, A. (2007) Communities at cross-purposes: Contradictions in the views of stakeholders of learning object repository systems. Proceedings ascilite, Singapore 2007.

Sunday, August 24, 2008

How do tags connect to the Thesaurus terms?

Our social tagging system in MELT is special in two ways:
  • one, we support multi-linguality
  • two, we have not only tags, but all resources that users tag also have Thesaurus terms
In that context it becomes very interesting to know how do tags relate to the Thesaurus terms that have been used to index the resources that users tag.

I took a sample of tagged resources (n=185) that have 1013 tags associated with them. Out of those tags, there are 595 distinct tags. There are 44 users.


I made a network diagram visualisation that displays the Thesaurus terms as nodes that are connected by edges to tags. You'll find it here to play around with it. Unfortunately, I found out that 24 resources did not have Thesaurus terms related to them(that's about 13%, hmmm), thus a big plumb node in the middle without a Thesaurus term.

There is another visualisation here, it's more explorative about the data.


It's rather interesting that 595 distinct tags from users can be comprised to 34 thesaurus terms. That is 17,5 tags per Thesaurus term on average. Of course it does not go like that, it's more like rich-get-richer-type of a story. In the visualisation above you can see that most tags are related to language learning, for example.

If you look at the distribution of tags you'll find that many of the top tags are also about languages. Interestingly, many of them repeat the topic of the resource, but some of them (clearly less) state something about the nature of the resource (e.g. interactive) or the type (e.g. exercise).

The problem with creating this kind of visualisation of tags on the system level will be that the resources seem to have too many Thesaurus term. If there are 5 or so indexing terms, everything becomes related to everything else. It might be interesting to either to ask limit the Thesaurus terms to three (as should be the case anyway) or ask the indexer to give one term priority over others.

The same also goes for content-based recommendations, btw. If there are too many terms, you recommend everything for everyone.

Wednesday, August 20, 2008

On the memory lane of the Internet - Paris 8

It's great to be getting older. It turns the Internet into a memory lane, something like cleaning your old cupboards in the place where you grew up, finding old pictures, mails, etc.

I just received a mail from someone asking me if this (updated link to Internet Archive: https://web.archive.org/web/20090501062208/http://membres.lycos.fr/riina/dea.html) was something that I have written. It was "mon memoire du DEA" from 1999 in the department of Hypermedia in Paris 8! I have not even put my name on it, but somehow this person was able to find it and associate it to me. Best of all is that she still found it useful for her studies, she wanted to cite it in her own dissertation on language teaching and new technologies, but since the text did not have the author nor the publication date, she found me. You never know, do you now..

So here it:
Riina Vuorikari
ENSEIGNEMENT ET APPRENTISSAGE
LE CAS DES LANGUES ÉTRANGÈRES
EFFETS DES TECHNOLOGIES DE L’INFORMATION ET DE LA COMMUNICATION
Date de parution: septembre 1999
Lieu de publication: L'Universite de Paris 8, Saint-Denis, France.

Notice the way that the title was written, no commas but different lines. Pretty arty, ha? It was mostly influenced by, hm, my really eccentric pormotor, J.Feat. So, I went back to my Yahoo! mail that I used already back then to check the mails between us when studying. Man, he was somewhat strange, but who would not be in Paris 8!

I always joked that the hardest task in it all was to get out of there with a diploma, what a mess. But Fun. A good place to hang out. Check out what the French version of wikipedia says about it. The English version is lame, it's hard to capture that feeling of "papa cools", all the old hippies from the late sixties who had installed themselves there ever since the Youth revolution of 1968. Every day there was (I bet still is) a student "manif", a little protest or signing a petition on this or that. When I read parts of my dissertation I noticed how that radicalism had snuck in..

D’un côté Internet offre " un accès libre au monde ", il est " international, pluriculturel et multilingue ", mais ceci est une image idéalisée d’Internet. D’un autre côté Internet est vu comme un média conditionné par McWorldet par les concepts d’américanisme à l’échelle mondiale. L’homogénéisation culturelle et le commerce électronique comptent sur l’idée que la consommation devient l’unique activité humaine qui uniforme le goût des consommateurs.

..and at the end about the future perspectives:

Une autre piste de recherche sera l’industrialisation de l’enseignement. Les questions soulevées par ces tendances sont multidimensionnelles : Est-ce que l’interaction humaine pourra être remplacée ? Est-ce que les enseignants qualifiés seront remplacés par les moins qualifiés une fois que le contenu du cours est mis en place sur Internet ou sur le cédérom ? Qui aura la propriété des contenus de ces cours qui sont devenus des produits à exploiter, le professeur ou l’administration de la faculté ? Qui aura l’intérêt à vendre ces contenus, qui aura les droits d’auteur et qui va gagner l’argent ?
Outch. Then again, there is lots of good stuff too. I love the translation of knowledge network in to "le tissu de savoir" or calling the whole Internet as " tissu social virtuel"! What a foresight! I remember sitting with my supervisor in the Montmartre graveyard and he was explaining that instead of talking about the Internet, I could use the term " tissu social virtuel", like a web woven in a tissue where the threads are all intervened, to illustrate the use of the Internet. pretty funny in its own way..

This is my opening line:
Internet est souvent associé au concept d’interactivité. Est-il possible d’exploiter cette propriété pour mettre en œuvre des techniques spécifiques pour l’enseignement de langues vivantes étrangères ? Au contraire de l’enfant qui apprend sa langue maternelle dans un environnement naturellement interactif - et de façon permanente - l’étudiant suit régulièrement un cours où l’immersion linguistique est artificielle et de courte durée. Jusqu’à quel point est-il possible de reconstituer, à partir d’un tissu social virtuel (=Internet) les conditions idéales d’apprentissage, particulièrement l’apprentissage des langues étrangères ?
I remember when I finally was writing my dissertation, my promotor was merciless. He really cracked the whip on me. But he knew how far to push, and at the end also I was really pleased with the result. After all, it was mention bien. When I thanked him for this, he said " Please, don't you give no "thank you" -- after all, it's my job...". That's a true educator! But hey, he could have taken some credit for it.

A funny thing was that he's English was perfect, but I only learned about that after we were done with all the writing. He was harsh on my French too. When I had already handed in the first version of my dissertation, he congratulated me on it. But half way down on his mail he says that in its current version no one can read it without lots of difficulties :
Toutefois, tu ne recevras ton diplôme que si tu déposes plus tard un nouvel exemplaire, corrigé de toutes les fautes de français -- il faut comprendre que cet exemplaire est destiné à la bibliothèque, et que, tel qu'il est, personne ne peux le lire sans une grande fatigue...
The final discussions that we had before my defense took place in Montmartre. We once met in that same café where they shot scenes for Amelie, or at the graveyard. I was quite surprised to see them in the movie, I remember.

It was also fun now to check out on some professors from Paris 8. I found Jean-Pierre Balpe who at the time was the head of the department of Hypermedia. Jean Clement who taught us a course on hypermedia. Imad Saleh, one of my "rapporteurs", is now the head of Laboratoire Paragraphe, that's the nickname of the deparment (so French, I love it!). Or Jean-Lois Weissberg - I never understood anything about his lectures, he talked about "telepercence" and such. I only remember that soulful intellectual Greek philosophy student who engaged in discussions with him about things that I could not follow. After all, they all carried the legacy of Pierre Levy who had just left the department year earlier.

I tried to dig out on my Lycos account where this stuff now resides, but I could not find my password and the system does not recognise my username :( But I found some other old stuff, like the index page of the site that I made at that time for Finnish students in Paris, Suomalainen Osakunta, my cool looking CV and the side of akseli that Pia, "Puumatyttö", teki suomalaisille taiteilijoille ja jota autoin jossain vaiheessa. Ihanaa!


Well there, that was a nice moment of memories from Paris and end of the Millennium.

Thursday, August 07, 2008

Can Social Information save teachers' time when choosing interesting learning resources?

One of my research questions is aimed at understanding what so called Social Information can do to help teachers to choose the right learning resources from a seemingly overwhelming collection. By Social Information I mean information about previous users' interactions with the resource. I am mainly interested in explicit annotations like ratings and tags, and more implicit ones like bookmarks.

As I'm interested in the use of resources that come from different countries than users do, I think Social Information (SI) should display not only annotations, but also information from where the user comes from.

One thing that I hypothesise is that among other things, Social Information, when associated with conventional metadata about learning resources, can make the decision making process faster for teachers when, for example, looking at the search result list. As a multilingual context in a repository can result in metadata that is in different languages, it could be speculated that Social Information indicating the origin of the users who have previously annotated the resource, could help the other users to make up their mind (see the image for an example).

We were interested in two different aspects:
  1. Does the appearance of Social Information make the decision making process any faster?
  2. Does the appearance of Social Information make the users choose more resources?

Method

We had 25 users from five different European countries. These teachers are primary and secondary teachers in science, language learning and ICTs in Finland, Estonia, Hungary, Belgium and Italy. xx of them are females and xxmales. xx participant is under 30 years old, xx are under 40 years, xx under 50 years, xx under 60 years old.

They have been part of the MELT project since Summer 2007. In March 2008 they were invited to create a profile on the MELT portal, where they are able to access multilingual learning resources for different topical areas.

We designed an experiment where teachers were shown two different imitations of search results list with learning resources and their associated metadata. One of the lists showed what we call the conventional metadata, such as title, url, language of the resource, a short description, subject area, type of content and its target audience. Here is an example.

The other list had the same metadata, but we also added the Social Information from the previous users. This could be the tags in their original language, the number of times bookmarked (favourites) and the ratings. Also, for bookmarks we would mention from which country the users come from. As example of this was shown above, the first image in this post.

We had 48 learning resources that came from different countries and were in different languages. About half of them were in English and other half in other languages, this also seems to reflect the division of the resources that users have bookmarked on the portal. The resources were about language learning, primary education, ICTs and science material, those were the areas of the teachers. I'll prepare better information about this later.

We had 12 learning resources on a page imitating a list of search results that user could get on a repository. In total, there were 4 such pages for each user, we call them sets. Every second set had conventional matadata, and every other had additionally also Social Information as indicated above.

At the beginning of the each set the participants were asked to write their names and the time when they started with the set of 12 resources. At the end, when they submitted their results, the system recorded a time. To answer to our first question we were interested in how much time do teachers spent to evaluate the appropriateness of 12 resources for them.

The teachers were asked to look at the metadata of the resource and the resource itself if interesting, and were asked one single question: "Would you use this resources, or parts of it, in your teaching in next Fall?" They answered on a scale 1 to 5, 1 being "I don't teach the topic", 2= No, 3= Maybe not, 4= Maybe and 5= Yes. Looking at the number of resources that users choose in their topical areas would give us indication of whether resources that have more Social Information related to them were more often chosen than the onces without.

Because of the low number of participants (n=25) we decided upon a within-subject design for this experiment. This is the one where the same group of subjects served in both treatments, i.e. they received both the material with conventional metadata and with social information.

Moreover, we had the participants in two different "groups". Group 1 had 12 participants and Group 2 had 13. Group 1 started first with a set with conventional metadata and Group2 with a set of resources that had Social Information added to it. When analysing the results, we found that one user in Group 2 had consistently added incorrect times. We excluded these times from the counts for time spent per set, leaving 12 participants in each. Moreover, in both set there were a few cases where the start time was forgotten.

Results

Descriptive statistics

We had 1129 responses to our questions, which means 71 responses were left blank. In 53% of the cases the users had answered that they do not teach the topic, which means that they deemed the resources not suitable for the topical area that they were teaching. 25.6% of the users found resources that they said that they would use (yes or maybe yes), whereas 21.6% of the resources were not found of use in the upcoming school year (not, maybe not). The mean for the responses was 2.23 (Min=1, Max=4), standard deviation was 1.138.

Q1: Does the appearance of Social Information make the decision making process any faster? Time spent on 12 resources (i.e. set)

On the average, users spent a bit more time on the sets that did not contain Social Information. The average to review a set of 12 resources with conventional metadata was 9 minutes and 8 minutes with Social Information.

I do not know yet whether this is a significant difference (my SPSS license ran out), but one could assume it is at least a sign of good news for Social Information. We can imagine that users go through a lot of resources when browsing a learning resources repository (I currently do not have the logs about the number of resources that users review per session, but I will produce them). So if you think of small cycles and multiply that number with, say 1o times, you could come up to some significant time savings when Social Information is made available to speed the decision making process.

Individual differences

Still looking at the average times spent, we can see that there were many individual differences. In the chart below the blue lines show the amount of time that participants spent with conventional metadata and the red one with Social Information added to it. You can see that for some users one metadata setting seems like a faster way, but anyhow, the lines follow one another pretty closely, apart from some odd-balls (like user 23). You can also see that there seem to be a wide variety of personal ways, some users scrutinise resources with a great care (user 7 and 8), whereas some go through them very fast (user 16 and 17).

I'd like to mention that here it does not matter that some of the resources are not in the competence area of the participants. We focus purely on the time that they spent going through pages and making decisions whether some of the resources are useful for them in the upcoming school year or not. However, this becomes crucial to answer to our second question:

Q2: Does the appearance of Social Information make the users choose more resources?

Table below presents the results when I looked at the amount of resources chosen per set. There was 4 different sets and each contained 12 learning resources in different languages. The two different treatments meant that teachers reviewed 2 sets with Social Information available, and two sets without. As teachers were from different tpical backgrounds, I excluded the responses from users who said that they do not teach the topic of the given resource. In table below you can see the percentile of positive responses (maybe use, use).

It appears that consistently teachers chose more resources when the Social Information was not available. This is contrary to what I expected. I have not calculated the significance of these results, but the differences do look big. In some cases, like in the 2nd set, even about 15% in favour of no Social Information available.

In a way, maybe the appearance of SI makes the teachers more careful or critical to choose the resources?

What is needed now is a follow up study at the end of this school term to check whether these teachers actually used the resources in their teaching. Or, I could check if they have bookmarked these resources on the MELT portal. They know the resources are available there. MORE to follow...

Wednesday, August 06, 2008

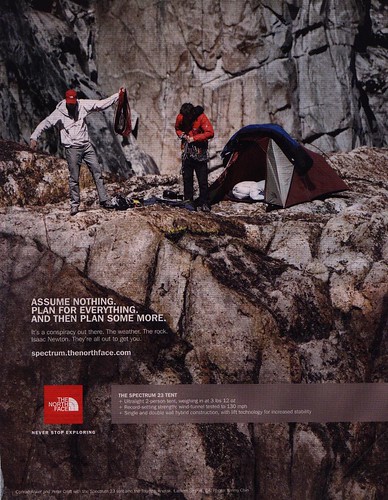
Asume nothing. Plan for everything.

I noticed this ad at the train station when I was returning from my weekend sailing trip in Friesland, Nl. It kinda captured the mood of the first half of this year, or better, it kind of captured the lesson I wish I have learned during that time. Assume nothing. Plan for everything. And then plan some more.

I think I sometimes assume too much and take things for granted. I think that everyone else is "with me" in the same thing or on a same (mental) trip, and I do not bother to explain the plot, set out my major expectations and go through all the details, etc. Then at one point, usually when it is already too late, I realise that this is not what I assumed it was.

Last weekend this dangerous thinking left me in the water when we accidentally capsized out small sail boat (seen in the pic)...and, there was no plan for what to do then. (one can be found here)

Clearly once again I had been trapped with my not so productive way of thinking. We had been sailing on a 6-meter open Falk boat already for a day with a crew of 4. My pal was skippering and we were 3 others with some/good sailing experience. I got in some really good sailing :) I managed to get us through a pretty rough channel with a strong head wind. We had to tack at least ten times to get to the other side, but I managed it all, we did not loose too much speed in turns and I made the guys jumping from side to another to give the weight to keep the boat from flipping. I realised that Falks are darn sensitive to your weight, it really makes a difference on which side you lean on.


So comes along the next day and we are sort of returning. We have one reef down because of the heavy winds. The skipper was steering, I was taking pics in the head, and the two others were somewhere in the middle. The next thing I hear is that one of us slips on the floor and tumbles on the side. Mind you, these are small boats, so by the time I turn to watch, he's trying to grab onto something and I'm sure he's going to fall off the boat.

With the sudden shift of his bodyweight and the heavy gust from the side, the next thing I observe is that he is not going to fall off the boat, but the boat is going to fall with him. I see our chart flying, the bottles and the gas jar landing in the water, and soon everyone else follows. Since I had yanked myself firmly in the head to take pictures, I found myself standing on the low side wall of the boat that now was horizontal in the water and slowly sinking down with more and more water getting in.

I was not sure what to do. Would it be better to stay in the boat or leave it. After a thought of the boat turning turtle, and seeing myself being tangled in the ropes under the boat, I decent in the water and start collecting our belonging. Soon enough I realise it's heavy to swim with cloths on and I thought "heck with our empty bottles of water and my fake crocks that I tried to save", and swam to the others who were on the other side of the boat. The skipper lifted me on the keel. I was like "so what now", but I did not get any instructions. I had not prepared for this and was not sure what was the next thing to do. Our weight on the keel did not have any effect on righting the boat (which was the goal that the skipper pursued).

Then, that's like seconds later, there was the rescue troop behind us. I could not figure how they were there so soon, but later they told me it was because of the regatta that was going on and they saw us capsize. They put a rope on our mast, and with a help of a second boat, we got it back right up. The mast was all muddy, the wind was pushing the boat so much that instead of turning all the way around, it got stuck in the low waters. No wonder our weight did not do a thing to right the boat.

We were eventually pulled back to the harbor by these Dutch gentlemen of the sea and left sorting out our dripping wet packages, cursing about wet mobile phones and the bill to pay for some lost gear from the boat.

In retrospect it feels just like what happened with the PhD where I got "snowflake*d" (i.e. my adviser at the time kicked me out of the programme) . What happened was just like with sailing, one day you feel like you can do all the good moves, and then the next is that you find yourself swimming in the water and wondering "this is not how I assumed it would end". The worst being that I was not prepared for it, I had not thought of what would be the plan B or C for that matter.

Reflecting on all this makes me see a reoccurring pattern that I'd better avoid in the future. It's clear that accidents will always happen and mistakes are made, but there are also precautions that can be taken to prevent them. Those are done by careful planning and someone taking clear leadership on things. Then the other thing is that when accidents happen or mistakes are made, one needs to know what to do next. Be prepared for them. And then some more.

Being comfortable having other people taking the lead is good, good leaders need good followers, like Dan is known to have said once. Perhaps it would be time for me to think more about taking leadership on things and try to influence, at least on my own life, that I'm prepared for everything. That is one characteristics that I expect from a skipper of a boat, and for that matter, it probably should go for any other areas too.

Monday, July 28, 2008

Measures for cross-border actions with Tags and Resources

If I break down the triple of {user, tag(s), resource} I can study the three things separately
  • User - resource
  • User - tags

  • Resource - users
  • Resource - tags

  • Tag - resource
  • Tag - users

And as I am especially interested in the cross-border actions, I would study the cases where:

User country ≠ Resource country

In this case I am interested in studying users collections of bookmarked resources, especially establishing the facts based on which country the resources are originated from. Using the cross-border metrics I can take a snapshot of the resources and calculate a cross-border resources value for the use.
  • E.g. User Finland has bookmarked Resource1 Poland , Resource2 Spain and Resource3Finland

  • This would make a User Finland to have a resource profile Poland 33%, Spain 33% and Finland 33%

  • In this case, as the user is from Finland, the cross-border profile would be 66% which would most likely have a value of .66, if we imagine that the cross-border value is between 0 and 1.
So what, you say. It makes a difference, I say.
  • This allows me to categorise this user into cross-border user of resources. I assume
    that users have differences in their inclination of using resources that come from different countries, some use them a lot others do not want to bother with them.

  • So this metric allows me to study who does what and thus better understand our user-base.

  • On the long run this of course will make it easier to recommend resources to users, as we
    already know that in their profile it shows that they are inclined to use cross-border resources.
Resource country≠ User country

This allows to me to look at the thing from a different point of view. Here, I am interested in establishing a profile for a resource. It appears that some resources are used a lot by people from different countries, whereas others are used predominantly by users from the same country than the resource itself is from.
  • E.g. Resource Finland has been bookmarked by User1 Poland , User2 Spain and User3Finland
  • This makes the ResourceFinland to have a profile Poland 33%, Spain 33% and Finland 33%.

  • In this case, as the resources is from Finland, the cross-border profile would be 66% of users, which would most likely have a value of .66, if we imagine that the cross-border value is between 0 and 1.
So what, you ask again. I think that it's cool, because then I can quickly and in an automated way calculate which of my resources have a high potent to cross borders easily. First of all, this will help me study whether there are some characteristics that make these resources to cross-borders.

Second, we can use this information to make filter out the resources that we think cross borders easily. This could be cool for example on our portal, we could flag out these resources for users, and furthermore, we could give these resources a priority when other repositories are harvesting or searching us in a federated manner.

Resource country Taglanguage
It'll also be interesting to create profiles for resources based on tags in different languages. For tag, we do not trace the country of origin, rather just the language. So in this case I'm interested in looking at resource profile on tags.
  • E.g. Resource Finland has been added a Tag1 Polish, Tag2 Spanish and Tag3 Finnish
  • This makes the ResourceFinland to have a tag profile Polish 33%, Spanish 33% and Finnish 33%.

  • In this case, as the resources is from Finland, the cross-border tag profile would be 66% of users, which would most likely have a value of .66, as above.
This is also an indication that the resource has a potent to cross borders. Tags in different language might yield some interesting information on how this learning resource could be used in a new context. In this example the resource was created in Finland, so one could assume that it has some underlying ingredients that make it suitable for Finnish curriculum. On the other hand, the fact that users have added tags in Polish and Spanish too might indicate that this resource is also useful for teachers in those countries.

Here an interesting case seem to emerge for topics like Language learning, say, English as Second Language (ESL). Language learning and teaching resources seem to be easily reusable in another language context. Interestingly, though, we've seen that in these cases teachers tend to tag them in the language in question.
E.g. User Finland has added a Tag English for ESL Resource Poland

Tag language Resource country

We can also look at the things from tags perspective.
  • E.g. Tag Finnish has been added to Resource1Poland, Resource2 Spain and Resource3 Finland
  • This makes the TagFinnish to have a resource profile Polish 33%, Spanish 33% and Finnish 33%.

  • In this case, as the resources is from Finland, the cross-border tag profile would be 66% of users, which would most likely have a value of .66, as above
This allows us to observe cases where a tag is related to learning resources that most likely share some thematic resemblance. It could be for example Science resources from different countries that Finnish teachers have collected. In this case we also can find evidence that these resources were adaptable to Finnish curriculum despite the fact that they come from other countries.

Tag language ≠ User country

On the other hand, we also find tags that have been used by users from different countries. These are the tags that we have previously identified as "travel well" tags. They have some interesting properties that make them easily understandable without translations, e.g. names (people, country, place), acronyms, common terms (web2.0).

By looking at the connection between Tag language and User country we can possibly identify such tags. The other common case for this seems to be that these people have tagged the resource in English. In any case, if many people have done that, we can identify these terms and manually analyse them. The hypothesis is that they either are "travel well" tags or then they are some super popular tags that could also count high on tag non-obviousness metric by Farooq et l (2007).

User country - Tag language
Lastly, just to enumerate the cases, we also have the relation User country and Tag language. This can be used to study user's personal tagging behaviour. In the previous study in Calibrate we found that on average users tag in their mother tongue and in English (75% to 25%). It seems though that things look different in MELT, where teachers are tagging more in English.

We are not sure whether these are personal preferences or the influence of social awareness, as in MELT tags are made readily available to others through a tag cloud, whereas in Calibrate they were only used for personal knowledge management reasons.

In any case, this relation allows us to measure individual differences between users and thus understand our user-base and possible user scenarios better.


What next? I will make a case study to apply these measures to MELT tags that we've got in the system so far

Dataset:
  • Learning resources: 199
  • Users: 40 (From Fi, Hu, Et, Be, At, It)
  • Tags:
    • 572 distinct,
    • 969 applied tags
    • 75% of tags were used only once
    • 25% of tags were used more than once

Tags and SNA measures

Studies on tags commonly have the triple of {user, tag(s), item} as a unit of study. That's also what I'm interested in, especially in those underlying structures that build relationships between users, tags and items. Some apply Social Network Analysis to study, for example the centrality measures of the network.

A run-down of SNA measures from Wikipedia

Betweenness
Degree an individual lies between other individuals in the network; the extent to which a node is directly connected only to those other nodes that are not directly connected to each other; an intermediary; liaisons; bridges. Therefore, it's the number of people who a person is connecting indirectly through their direct links.
(Somewhere else:The betweenness measurement indicates a node or nodes that connect clusters of nodes. Nodes that have hight betweenness have high influence over what information flows in the network.)
Closeness
The degree an individual is near all other individuals in a network (directly or indirectly). It reflects the ability to access information through the "grapevine" of network members. Thus, closeness is the inverse of the sum of the shortest distances between each individual and every other person in the network.
(Degree) centrality
The count of the number of ties to other actors in the network. See also degree (graph theory).
Flow betweenness centrality
The degree that a node contributes to sum of maximum flow between all pairs of nodes (not that node).
Eigenvector centrality
a measure of the importance of a node in a network. It assigns relative scores to all nodes in the network based on the principle that connections to nodes having a high score contribute more to the score of the node in question.
Centralization
The difference between the n of links for each node divided by maximum possible sum of differences. A centralized network will have many of its links dispersed around one or a few nodes, while a decentralized network is one in which there is little variation between the n of links each node possesses
Clustering coefficient
A measure of the likelihood that two associates of a node are associates themselves. A higher clustering coefficient indicates a greater 'cliquishness'.
Cohesion
The degree to which actors are connected directly to each other by cohesive bonds. Groups are identified as ‘cliques’ if every actor is directly tied to every other actor, ‘social circles’ if there is less stringency of direct contact, which is imprecise, or as structurally cohesive blocks if precision is wanted.
(Individual-level) density
the degree a respondent's ties know one another/ proportion of ties among an individual's nominees. Network or global-level density is the proportion of ties in a network relative to the total number possible (sparse versus dense networks).
Path Length
The distances between pairs of nodes in the network. Average path-length is the average of these distances between all pairs of nodes.
Radiality
Degree an individual’s network reaches out into the network and provides novel information and influence
Reach
The degree any member of a network can reach other members of the network.
Structural cohesion
The minimum number of members who, if removed from a group, would disconnect the group.[15]
Structural equivalence
Refers to the extent to which actors have a common set of linkages to other actors in the system. The actors don’t need to have any ties to each other to be structurally equivalent.
Structural hole
Static holes that can be strategically filled by connecting one or more links to link together other points. Linked to ideas of social capital: if you link to two people who are not linked you can control their communication.
What made me think of this now was that I read this mini study Using Social Network Analysis to Highlight an Emerging Online Community of Practice. Anthony Cocciolo, Hui Soo Chae, Gary Natriello, Teachers College, Columbia University

The method used made me tick. They used
..System Theory to define the uploading and downloading of materials as "communicative acts", the users of the system were the "actors" and the cululative communicative exchanges as "interactions" (Buckley, 1967). .. this particular systems arrangement is useful because it provides a readily available metric for assessing actors' interactions within a network.
I think it might be interesting to think how this could be used to study the underlying networks with tags.


The most comprehensive reference is: Wasserman, Stanley, & Faust, Katherine. (1994). Social Networks Analysis: Methods and Applications. Cambridge: Cambridge University Press. A short, clear basic summary is in Krebs, Valdis. (2000). "The Social Life of Routers." Internet Protocol Journal, 3 (December): 14-25.

Thursday, July 10, 2008

Notes: Tagging tagging. Analysing user keywords in scientific bibliography management systems

An interesting paper on JoDI about tagging in bibliography management system.
Tagging tagging. Analysing user keywords in scientific bibliography management systems
Christian Wolff, Markus Heckner, Susanne Mühlbacher
Journal of Digital Information, Vol 9, No 27 (2008)

Some outcomes:

a category model for tags in a scientific bibliography management scenario. This model covers linguistic features, the relation between tags and the text of the tagged resources, as well as functional and semantic aspects of social tags.
Here is an image of the model that I copied from the paper:


This is actually a really cool model for tags. I've been so far using three categories from MovieLens and Golder (2006)/Huberman (2005) studies; Factual, subjective and personal. I've noticed, though, that I've added many sub-categories for the Factual ones.

Like in this model, I've discovered very similar types in tags. Especially the "Functional Category Model" is interesting : it has 2 sub-classes:
  • subject related (e.g. resource related and content related) and
  • non-subject related, personal tags (e.g. affective, time and task related, tag avoidance=no tags).

Other things:
The ”typical tag” is a single-word noun, taken from the title of the respective article
(identical or variation), thus directly related to the respective subject.
Yep, we have many of these too! When I talk about these I refer to the non-obviousness metric from Farooq et al. (2007).

In contrast to previous studies the number of non-subject related tags remains rather low in the scientific data we observed and the full potential of tagging systems to describe qualities or aspects of resources does not seem to be used. But the absence of tags like cool, interesting, to_read does not mean that users who tagged the resource do not think it is cool, of interest or worthy of reading, but simply that the users did not express their ideas they may have or may not have about the resource.

This is interesting too. I think each audience tags differently. Our target audience are teachers, about 35-55 years old. They do not seem to go around tagging learning resources with tags like cool, etc.
Compared to author keywords, social tags tend to introduce less and simpler con-
cepts: Altogether, only one third of the social tags matched with (the far more numerous) authors’ keywords. Moreover, tags tend to be more general and users tag their articles more general and with less words than authors.

This is also interesting. There are some studies that have compared the tags and expert indexer keywords and have found even less overlap, if I remember right.

I love this one, it is so much the case:
Additionally, it shows that the respective system environment, e.g. tag suggestions, has a major influence on the tagging behaviour in terms of spelling errors, tag usage and creation of a specific tagging languages. This extends the number of the main influential factors on tagging behaviour being personal tendency and community influence through the additional component system influence.


They also flag out as an interesting study area the comparative studies across tagging platforms. I've looked at different tagging systems for educational resources a bit. This version is an old one, but I post it anyway:

Vuorikari, R., Poldoja, H. (submitted). Comparing tagging and its purposes across learning resource repositories. pdf

Wednesday, July 09, 2008

Teachers as Netpromotors of digital content

I made a survey with 28 teachers from different European countries on multilingual learning resources. You can find those 28 resources from this list. Our portal has a lot of multilingual resources that come from a variety of Ministries of Education in Europe.

But - we do not know for sure whether teachers find resources useful that come from different countries than they do, and that are in different languages than they speak. Hence my little survey. You can read more details here.

We only considered responses from teachers who came from different countries than the 18 resources did that we had in our survey. Quick round of results:
  • 43% of respondents found resources, which came from a different country than they did, of use for preparation purposes.

  • 41% of respondents found resources, which came from a different country than they did, of use for teaching purposes.

  • 65% of respondents said that they would share these resources, or parts of them, with their colleagues and friends.

  • Even 35% of respondents, who said they did not have expertise in the given subject area, thought that they would share the resource with their colleagues
These were the results on a scale 1-5 (n=254)


It made me think that:

a) If teachers use multilingual or foreign language resources, they most likely use them both for preparatory purposes and for teaching purposes. We do not know, though, whether they would use the resource in their teaching themselves or let pupils interact with this resource.

b) Teachers are good filters. More teachers said that they would be willing to share resources with their colleagues than actually use them themselves. It might be that this happens with a resource, which they think is interesting, but does not match to their curriculum goals for the year. They might say, "Hey, my colleague would love this, I'll send it to her!" This is the basic mechanism of viral marketing, how can we leverage this on a learning portal?

c) "Would you like to share it with your colleagues" is one of the key questions when studying customer satisfaction and loyalty, topic that we in learning repositories often neglect. If teachers are happy users, or if teachers find good material on the portal, they can become promoters of those resources. This might be very important especially when we deal with resources that are in multiple languages, because sometimes it is hard to discovery those resources.

If we take the teachers in the survey, we could calculate the Net Promoter Score by subtracting the % Detractors (e.g. the ones in my survey who rated this 1 or 2 on the scale 1-5) from the % Promoters (e.g. the ones in my survey who rated this 4-5).

Take the case for sharing: it would be 65% -22% =43%. That is a pretty good net promoter score, most companies have it around 5 to 10%, and it is very unusual to have it above 50%.

This can indicate that teachers are willing to put their credibility on the line by recommending a resource that comes from a different country than they do to a friend!

Now, I just have to think of the best way to do this ;)

A draft idea for a paper: A case study on teachers' use of social tagging tools to create collections of resources - and how to consolidate them?

UPDATE: the submitted paper, comments welcome!

This paper explores how a group of pilot teachers (16) create collections of digital learning resources using tagging tools. We study two different tools: an educational portal (MELT) and del.icio.us. We first look at the characteristics of these collections (number of resources, languages of resources, number of tags used, etc), and then propose a way to display the resources and tags from del.icio.us on the learning portal (MELT) using Attention Profing Markup Language (APML). This allows a higher level of integration between a learning portal and an external social tagging service like del.icio.us, and thus enhances the wider variety of digital learning resources to be discovered.

Method

We selected 16 pilot teachers to be subjects of this study from the MELT project. These teachers have both an account on the MELT portal and on the delicious bookmarking service. These teachers are primary and secondary teachers in science, language learning and ICTs in Finland, Estonia, Hungary and Belgium. 7 of them are females and 10 males. One participant is under 30 years old, 8 are under 40 years, 5 under 50 years, 3 under 60 years old.

They have been part of the MELT project since Summer 2007, when they were first introduced to delicious during a summer school. In March 2008 they were also invited to create a profile on the MELT portal, where they were able to access multilingual learning resources for different topical areas.

From the MELT portal we know the detailed profiles of these teachers: their names, topics they teach, country where they teach and languages they speak. Moreover, we have information regarding the learning resources that they have bookmarked using the portal. This includes the information about the resource itself and the tags applied. We additionally have asked for their delicious username to be part of this small study.

From delicious, using the html service, we were able to download the 100 last bookmarks and tags that these teachers had posted on delicious. We also took all the data regarding the tags and people these users had in their network. Lastly, we recorded the number of posts each teacher had on their account.

We collected the following data for our selected 16 users:


Additionally, the delicious data contained the following information regarding the networks. Two people had chosen to keep their networks private:
  • Number of distinct people in the networks: 104
  • Number of people in the networks: 270
Results
Discussion


References

del.icio.us API and other not so successful trials

I am getting somewhat disappointed in some of these web 2.0 "things". Take, for example, the delicious API.

I wanted to download the posts by a number of ppl in my network to study what the hell are they doing. The API allows you to download all your posts in a neat xml format. That's cool, I thought, let me just do this to 20 of my buddies, and I can study better how teachers are bookmarking - especially how are they bookmarking websites that are not from their own countries or in their own languages (e.g. cross-border use).

The delicious API only allows you to get 30 latests posts from people that you do not know the password of. wtf? The same if you try to get them through RSS feeds, you only get 30. Then, there is the html code that you can use, but it also allows you to get only 100 posts. What about the rest, those 999 posts that I want? That stuff is so badly documented on the site that it's very annoying. Why not just be frank about it and say this is how things are?

I do not understand why to limit the API, RSS or html code when all that stuff is freely viewable anyway. So I tried using wget to suck that stuff out, but there is also something fishy and I can never get past 100 posts. So, I guess that just makes me to limit my study to a sample of 100 posts per user. Easy.

The other thing that I've been sightly disappointed with lately is APML and a number of tool that they make available for you to track your online profile, like engagd.com or tagurself.com.

You know what, the idea is great, but those tools/widgets suck, and they are so badly documented that it makes you just wanna cry. I've tried like 3 times in engagd to make my APML profile of 2 different feeds, and it never works. The tagurself cannot even load the example from the url that they have themselves posted as an example. wtf?

Moreover, the Yahoo! pipes are also somewhat strange, they never actually seem to post what they should. I put this example in one of my lasts post and it hardly never loads. Not so fun.

Hmm...I guess if more people used all these 2.0 tools, and not only talked about their potentially revolutionary usage by non savvy web-users, we could face the fact that the user-created web is far from being so revolutionary and does not empower users like me. Instead, I'd like to see those folks walk that talk, sit down on their asses and finally get past the BETA versions of their tools to actually make them work properly. Dude, cannot wait to get rid of all the BETA versions on the web.

Tuesday, July 08, 2008

Friday, June 13, 2008

Pipe trial for delicious

Monday, June 02, 2008

This is it! Resources that cross boundaries

Ok, I think this graph is the coolest kid in the blog!!


What you can see here are the communities of users by mother tongue (nodes) and the edges are the resources that these users have added to their collections.

This is a great visualisation of communities of practice. What you can see here at a glimpse is that the learning resources that these users have added to their collections, are very much community oriented, in this divided by languages.

I sometimes frame my research question as the following:
Does a multi-lingual and multi-cultural learning resources portal rather act as one system divided into different language or country groups, or is it more like one monolingual system with its own sub-groups and communities of practice (think of a system like delicious) that cross the language and cultural borders?
This visualisation seems to point more to the first one (this REALLY needs to be further investigated!!), it seems that users are divided into groups by mother tongue. Why I say so is that you cannot see many resources that are shared among the groups.

To play around with this by yourself, make sure that you click on the arrow head down at the menu bar. This allows you to see in which directions the links go. They often time just go to one direction.

There are some resource that indicate communities of interests between countries. For example, in this image, we can see that there are some resources that are shared by both Estonian and Lithuanians. One of them is highlighted in orange.

These are the interesting resources as they cross between boundaries. The more I think of it, the more I'm convinced that you cannot call these call boundary objects (see my previous post). If I got the boundary object right, they are the objects that help these two groups to talk to one another, because they do not share the same language or jargon. But in this case, I think it's the contrary, these people share so much the same, that they can even share resources in Russian (of course being ex-Soviet countries, Russian is a common knowledge).

Anyway, even if the rather disappointing news were that users on an international portal seem to stick to one another based on their mother tongue rather than common educational interests, the good news is that I believe that through making more social cues and traces available to them, they would actually start exploring the resources in other languages and other areas.

And besides, who says that my data here really actually displays this community correctly!? This is based only on the common resources that users have put to their collections. Actually, LeMill is more of an authoring environment, so maybe a better way to study this community would be through collaborative authoring of learning resources? Or something else, like common search terms or tags that are used.

So, take this exploratory description of this data set with a little bit of skepticism!

In what languages are the resources that end-up in collections?

Well then, I guess that will be a no-brainer...

In this visualisation, you can see the languages of resources (e.g. English) as nodes and the languages of users as edges (e.g. en, de..).


If you click, for example, on English, lot of edges are highlighted. Those are the mother tongues of users who have bookmarked these resources. After little bit of playing, you'll find that English resources, and the ones with no languages, seem to be most popular with users.

However, it is cool to see that resources in other languages also end up in users' collections. Here, for example, you can see that Czech (sorry for misspelling) are used also by users with Polish and Lithuanian as mother tongue.

More analyses are needed to give you any numbers, but this already is an interesting insight.

Resources country of origin and user mother tongue

This visualisation shows the links between the country, where the resources in the collections were created in, and the mother tongue of the users who had added them in their collections. You can explore the diagram by yourself.

This image here shows how, for example, resources created in Finland (the orange node in the network) have ended up in collections of users who speak Hungarian, Estonian, Lithuanian, etc. as their mother tongue.

Note that this graph does not make any assumption of the language in which these resources are in! If I'm right in my guess, most of these resources were in English, not in Finnish..

But anyhow, I find that as a demonstration that these resources can cross borders of some kind. In this case, a Finn has created the resource. It can be just a very little hint available in the design of the resource that it was a Finn, but still some of the underlying pedagogical assumptions or some hints of Finnish curriculum might be embedded in these resources. Nevertheless, or thanks to that, the resources created in Finland seem like a hit (they are in 8 different language groups).

Ok, to me more truthfully, I think this is because LeMill was create in Finland that many of the Finnish resources are shared.