Wednesday, July 09, 2008

Teachers as Netpromotors of digital content

I made a survey with 28 teachers from different European countries on multilingual learning resources. You can find those 28 resources from this list. Our portal has a lot of multilingual resources that come from a variety of Ministries of Education in Europe.

But - we do not know for sure whether teachers find resources useful that come from different countries than they do, and that are in different languages than they speak. Hence my little survey. You can read more details here.

We only considered responses from teachers who came from different countries than the 18 resources did that we had in our survey. Quick round of results:
  • 43% of respondents found resources, which came from a different country than they did, of use for preparation purposes.

  • 41% of respondents found resources, which came from a different country than they did, of use for teaching purposes.

  • 65% of respondents said that they would share these resources, or parts of them, with their colleagues and friends.

  • Even 35% of respondents, who said they did not have expertise in the given subject area, thought that they would share the resource with their colleagues
These were the results on a scale 1-5 (n=254)


It made me think that:

a) If teachers use multilingual or foreign language resources, they most likely use them both for preparatory purposes and for teaching purposes. We do not know, though, whether they would use the resource in their teaching themselves or let pupils interact with this resource.

b) Teachers are good filters. More teachers said that they would be willing to share resources with their colleagues than actually use them themselves. It might be that this happens with a resource, which they think is interesting, but does not match to their curriculum goals for the year. They might say, "Hey, my colleague would love this, I'll send it to her!" This is the basic mechanism of viral marketing, how can we leverage this on a learning portal?

c) "Would you like to share it with your colleagues" is one of the key questions when studying customer satisfaction and loyalty, topic that we in learning repositories often neglect. If teachers are happy users, or if teachers find good material on the portal, they can become promoters of those resources. This might be very important especially when we deal with resources that are in multiple languages, because sometimes it is hard to discovery those resources.

If we take the teachers in the survey, we could calculate the Net Promoter Score by subtracting the % Detractors (e.g. the ones in my survey who rated this 1 or 2 on the scale 1-5) from the % Promoters (e.g. the ones in my survey who rated this 4-5).

Take the case for sharing: it would be 65% -22% =43%. That is a pretty good net promoter score, most companies have it around 5 to 10%, and it is very unusual to have it above 50%.

This can indicate that teachers are willing to put their credibility on the line by recommending a resource that comes from a different country than they do to a friend!

Now, I just have to think of the best way to do this ;)

A draft idea for a paper: A case study on teachers' use of social tagging tools to create collections of resources - and how to consolidate them?

UPDATE: the submitted paper, comments welcome!

This paper explores how a group of pilot teachers (16) create collections of digital learning resources using tagging tools. We study two different tools: an educational portal (MELT) and del.icio.us. We first look at the characteristics of these collections (number of resources, languages of resources, number of tags used, etc), and then propose a way to display the resources and tags from del.icio.us on the learning portal (MELT) using Attention Profing Markup Language (APML). This allows a higher level of integration between a learning portal and an external social tagging service like del.icio.us, and thus enhances the wider variety of digital learning resources to be discovered.

Method

We selected 16 pilot teachers to be subjects of this study from the MELT project. These teachers have both an account on the MELT portal and on the delicious bookmarking service. These teachers are primary and secondary teachers in science, language learning and ICTs in Finland, Estonia, Hungary and Belgium. 7 of them are females and 10 males. One participant is under 30 years old, 8 are under 40 years, 5 under 50 years, 3 under 60 years old.

They have been part of the MELT project since Summer 2007, when they were first introduced to delicious during a summer school. In March 2008 they were also invited to create a profile on the MELT portal, where they were able to access multilingual learning resources for different topical areas.

From the MELT portal we know the detailed profiles of these teachers: their names, topics they teach, country where they teach and languages they speak. Moreover, we have information regarding the learning resources that they have bookmarked using the portal. This includes the information about the resource itself and the tags applied. We additionally have asked for their delicious username to be part of this small study.

From delicious, using the html service, we were able to download the 100 last bookmarks and tags that these teachers had posted on delicious. We also took all the data regarding the tags and people these users had in their network. Lastly, we recorded the number of posts each teacher had on their account.

We collected the following data for our selected 16 users:


Additionally, the delicious data contained the following information regarding the networks. Two people had chosen to keep their networks private:
  • Number of distinct people in the networks: 104
  • Number of people in the networks: 270
Results
Discussion


References

del.icio.us API and other not so successful trials

I am getting somewhat disappointed in some of these web 2.0 "things". Take, for example, the delicious API.

I wanted to download the posts by a number of ppl in my network to study what the hell are they doing. The API allows you to download all your posts in a neat xml format. That's cool, I thought, let me just do this to 20 of my buddies, and I can study better how teachers are bookmarking - especially how are they bookmarking websites that are not from their own countries or in their own languages (e.g. cross-border use).

The delicious API only allows you to get 30 latests posts from people that you do not know the password of. wtf? The same if you try to get them through RSS feeds, you only get 30. Then, there is the html code that you can use, but it also allows you to get only 100 posts. What about the rest, those 999 posts that I want? That stuff is so badly documented on the site that it's very annoying. Why not just be frank about it and say this is how things are?

I do not understand why to limit the API, RSS or html code when all that stuff is freely viewable anyway. So I tried using wget to suck that stuff out, but there is also something fishy and I can never get past 100 posts. So, I guess that just makes me to limit my study to a sample of 100 posts per user. Easy.

The other thing that I've been sightly disappointed with lately is APML and a number of tool that they make available for you to track your online profile, like engagd.com or tagurself.com.

You know what, the idea is great, but those tools/widgets suck, and they are so badly documented that it makes you just wanna cry. I've tried like 3 times in engagd to make my APML profile of 2 different feeds, and it never works. The tagurself cannot even load the example from the url that they have themselves posted as an example. wtf?

Moreover, the Yahoo! pipes are also somewhat strange, they never actually seem to post what they should. I put this example in one of my lasts post and it hardly never loads. Not so fun.

Hmm...I guess if more people used all these 2.0 tools, and not only talked about their potentially revolutionary usage by non savvy web-users, we could face the fact that the user-created web is far from being so revolutionary and does not empower users like me. Instead, I'd like to see those folks walk that talk, sit down on their asses and finally get past the BETA versions of their tools to actually make them work properly. Dude, cannot wait to get rid of all the BETA versions on the web.

Tuesday, July 08, 2008

Friday, June 13, 2008

Pipe trial for delicious

Monday, June 02, 2008

This is it! Resources that cross boundaries

Ok, I think this graph is the coolest kid in the blog!!


What you can see here are the communities of users by mother tongue (nodes) and the edges are the resources that these users have added to their collections.

This is a great visualisation of communities of practice. What you can see here at a glimpse is that the learning resources that these users have added to their collections, are very much community oriented, in this divided by languages.

I sometimes frame my research question as the following:
Does a multi-lingual and multi-cultural learning resources portal rather act as one system divided into different language or country groups, or is it more like one monolingual system with its own sub-groups and communities of practice (think of a system like delicious) that cross the language and cultural borders?
This visualisation seems to point more to the first one (this REALLY needs to be further investigated!!), it seems that users are divided into groups by mother tongue. Why I say so is that you cannot see many resources that are shared among the groups.

To play around with this by yourself, make sure that you click on the arrow head down at the menu bar. This allows you to see in which directions the links go. They often time just go to one direction.

There are some resource that indicate communities of interests between countries. For example, in this image, we can see that there are some resources that are shared by both Estonian and Lithuanians. One of them is highlighted in orange.

These are the interesting resources as they cross between boundaries. The more I think of it, the more I'm convinced that you cannot call these call boundary objects (see my previous post). If I got the boundary object right, they are the objects that help these two groups to talk to one another, because they do not share the same language or jargon. But in this case, I think it's the contrary, these people share so much the same, that they can even share resources in Russian (of course being ex-Soviet countries, Russian is a common knowledge).

Anyway, even if the rather disappointing news were that users on an international portal seem to stick to one another based on their mother tongue rather than common educational interests, the good news is that I believe that through making more social cues and traces available to them, they would actually start exploring the resources in other languages and other areas.

And besides, who says that my data here really actually displays this community correctly!? This is based only on the common resources that users have put to their collections. Actually, LeMill is more of an authoring environment, so maybe a better way to study this community would be through collaborative authoring of learning resources? Or something else, like common search terms or tags that are used.

So, take this exploratory description of this data set with a little bit of skepticism!

In what languages are the resources that end-up in collections?

Well then, I guess that will be a no-brainer...

In this visualisation, you can see the languages of resources (e.g. English) as nodes and the languages of users as edges (e.g. en, de..).


If you click, for example, on English, lot of edges are highlighted. Those are the mother tongues of users who have bookmarked these resources. After little bit of playing, you'll find that English resources, and the ones with no languages, seem to be most popular with users.

However, it is cool to see that resources in other languages also end up in users' collections. Here, for example, you can see that Czech (sorry for misspelling) are used also by users with Polish and Lithuanian as mother tongue.

More analyses are needed to give you any numbers, but this already is an interesting insight.

Resources country of origin and user mother tongue

This visualisation shows the links between the country, where the resources in the collections were created in, and the mother tongue of the users who had added them in their collections. You can explore the diagram by yourself.

This image here shows how, for example, resources created in Finland (the orange node in the network) have ended up in collections of users who speak Hungarian, Estonian, Lithuanian, etc. as their mother tongue.

Note that this graph does not make any assumption of the language in which these resources are in! If I'm right in my guess, most of these resources were in English, not in Finnish..

But anyhow, I find that as a demonstration that these resources can cross borders of some kind. In this case, a Finn has created the resource. It can be just a very little hint available in the design of the resource that it was a Finn, but still some of the underlying pedagogical assumptions or some hints of Finnish curriculum might be embedded in these resources. Nevertheless, or thanks to that, the resources created in Finland seem like a hit (they are in 8 different language groups).

Ok, to me more truthfully, I think this is because LeMill was create in Finland that many of the Finnish resources are shared.

About networks of resources and users

This visualisation is to explore the networks of users that form between resources that are shared in collections. I think this is one of the most interesting visualisations of the dataset, and the one that inspires me the most.

Same as before, click to interact within the image, or if you click on the title on top of the image, you can get the network in a bigger window.


What's there? It's a network diagram where the nodes represent users (user id number) and the edges are the names of learning resources that these users have saved in their collections.


You can zoom into the diagram and explore it. Same as with the previous post, we can see that lots of the resources that users have put in their collections are not shared with other users. These are the singletons that are not part of the common network here.

Then, there are some star like structures that can be found. Like this one. Here the resource highlighted is something that both users (user 59 and 155) had added into their collection.

What I think, I would almost bet on, is that if these users were made aware that they share this resource in their collections, they would be interested in looking at what other resources are in the other person's collection. In this case the user 59 could be interested in looking at the collection of the user 155 has put in her collection.

This basically would be the idea of making underlying social networks visible in a repository to allow social navigation of like-minded users collections. Or, if you wish, a recommender could take advantage of these underlying connections as well. For the recommender, though, the data is very sparse, as can be seen from the visualisation. For that reason, I think we first should explore social navigation possibilities, and then launch for recommenders, when we get more data.

These resources that connect users, or in some cases (hopefully one day) even communities together, are valuable stuff. I have previously referred to this as one way to identify learning resources that cross borders easily. In this case, the two communities could be speaking different languages or be from different countries.

Some suggested that these objects could be also boundary objects. I cannot get my hands on the original article now (frustration of working from home!), so I am referencing some others that reference it:
Star (1989) and Star and Griesemer (1989), on the other hand, are concerned with the distribution of artefacts across communities. Boundary objects are artefacts used by communities: they cross the boundaries between communities and retain their structure, but are interpreted differently by them. The notion of boundary objects was developed by Star (1989) and Star and Griesemer (1989) as a way to explain co-ordination work between communities.
In a larger sense, maybe some of them could be boundary objects. I will need to think about this more..

Anyway, here is another little visulaisation that is actually an overview of the resources that users have saved in their collections. You can visualise it in many ways, you the ordering function on the top.


Star, S. L. 1989. The structure of ill-structured solutions: boundary objects and heterogeneous distributed problem solving. In Distributed Artificial intelligence (Vol. 2), M. Huhns, Ed. Morgan Kaufmann Publishers, San Francisco, CA, 37-54.

Learning resources as part of collections - what about the network?

I'm just exploring a new dataset that I got from LeMill, it contains information about learning resources that users have put in their "collections". Collections is a tool for users to create their own sub-sets of resources and give them a common title, e.g. I find 5 resources on pyramids, I add them to my collection, and I call it "Pyramids for 5th graders", as I am going to use it during my History lesson that I teach with 5th graders.

I think that collections-tool is an excellent tool, also for me as a researcher ;) What I am interested in knowing is whether we could make the links between these collections visible. The link would, of course, be the resources that are shared with collections.

Let's just explore the early visualisation of LOs connecting the collections. Click on "click to interact", and you get the life image. Alternatively, you can click on the title in the image, and you'll have the whole visualisation in a bigger interface. So what's there?


What you first see is a top-level overview of users' collections using a network diagram. It first looks like a grid; the ones on the top left hand corner are small one, they only contain a few resources. The other ones towards the right bottom corner look more clunky and visibly bigger, they include many more resources and are actually overlapped one with another.

You can start zooming in with your mouse. You see that some names will start appearing. Those are the name of the collection and the resources within. With a right click on your mouse, you see a hand appearing. This allows you to move within the visualisation. What you see here is a huge amount of what is called “singletons” in the network jargon. These singletons are collections, but they do not have any connections through shared resources to other collections.

Now, try to locate yourself in the area where that big cluster is, at the bottom right hand corner.

Now, instead of looking at separate little singletons, we are hoovering over a “giant component”. This is clearly the largest group of nodes within this network and some of them seem interconnected. With interconnection I mean that the same resource is in more than one connection.

You can visualise this nicely, if you click on some of the big nodes. It will be highlighted in orange. This way you can see what are the resources related to this collection (the collection name is the node). Interestingly, you'll see some of the resources act as a connection between different collections.

What we can already quickly see is that something called “middle regions” are entirely missing from this network. They represents rather isolated groups that interact amongst themselves. In our case they would be a few resources that are in a few collections by a few users. There do not seem to be any such "isolated stars" in this network of collections. The cool thing about these isolated stars is that over some period of time, they might merge with the giant component. This would happen through a resource that is shared in both the giant component and the smaller entity.

Ok, visualisation is just a visualisation, a snapshot of a moment. More work is needed to properly analyse what is going on, and most importantly, does this have anything to do with how we can make a repository of learning resources a better place?

Well, I of course am on my SNA trip and think that it can help anything and everything, but more about that later..

Reference

Users, LOs, collections and networks forming

This visualisation is to explore the networks of users that form between resources that are shared in collections. I think this is one of the most interesting visualisations of the dataset, and the one that inspires me the most.

Same as before, click to interact within the image, or if you click on the link, you can get the network in a bigger window.

What's there? It's a network diagram where the nodes represent users (user id number) and the edges are the names of learning resources that these users have saved in their collections.


You can zoom into the diagram and explore it. Same as with the previous post, we can see that lots of the resources that users have put in their collections are not shared with other users. These are the singletons that are not part of the common network here.

Then, there are some star like structures that can be found. Like this one. Here the resource highlighted is something that both users (user 59 and 155) had added into their collection.

What I think, I would almost bet on, is that if these users were made aware that they share this resource in their collections, they would be interested in looking at what other resources are in the other person's collection. In this case the user 59 could be interested in looking at the collection of the user 155 has put in her collection.

This basically would be the idea of making underlying social networks visible in a repository to allow social navigation of like-minded users collections. Or, if you wish, a recommender could take advantage of these underlying connections as well.

These resources that connect users, or in some cases (hopefully one day) even communities together. They are valuable stuff. I have previously referred to this as one way to identify learning resources that cross borders easily.

Some suggested that these objects could be also boundary objects. I cannot get my hands on the original article now (frustration of working from home!), so I am referencing some others that reference it:
Star (1989) and Star and Griesemer (1989), on the other hand, are concerned with the distribution of artefacts across communities. Boundary objects are artefacts used by communities: they cross the boundaries between communities and retain their structure, but are interpreted differently by them. The notion of boundary objects was developed by Star (1989) and Star and Griesemer (1989) as a way to explain co-ordination work between communities.
In a larger sense, maybe some of them could be boundary objects. I will need to think about this more..

Anyway, here is another little visulaisation that is actually an overview of the resources that users have saved in their collections. You can visualise it in many ways, you the ordering function on the top.


Star, S. L. 1989. The structure of ill-structured solutions: boundary objects and heterogeneous distributed problem solving. In Distributed Artificial intelligence (Vol. 2), M. Huhns, Ed. Morgan Kaufmann Publishers, San Francisco, CA, 37-54.

From Attention metadata to Participatory metadada

Capturing and taking advantage of users’ actions on the Web has come a long way since business models were first implemented around the idea of clickstream in the ’90 . Instead of having the commercial sites taking advantage of the attention that users pay to different products, in the recent years the tide has turned arguing that interactions with the content (e.g. buying, listening, reading feeds) and users reactions to that content (e.g. ratings, reviews, tags) should be something that the user can control.

AttentionTrust.org, for example, calls this "attention data" and argues that it is a valuable resource that reflects user’s interests, activities and values, thus serves as a proxy for their attention.

AttentionXML (1) is an open specification to capture individual’s clicks to track user’s behaviour and information consumption on the Web. Contextualized Attention Metadata (CAM) schema was build upon it with an extension that allows capturing observations about users activities in any kind of tool, not just a browser or newsreader (Najjar et.al. 2006a,b).

Attention Profiling Markup Language (APML), on the other hand, offers a way for a user to create a personal Attention Profile, which is portable, sharable and captures users’ attention on self-defined services. Moreover, the social aspect of the Web, where users not only interact with resources, but actually participate in communities and create content, has created a need for users to capture these participatory aspects of their attention.

Thus User Labor Markup Language (ULML) that proposes an open data structure to outline the metrics of user participation in social web services. One of the ULML use cases, for example, is around creating metadata (e.g. tagging, voting, commenting etc.) as a way to improve and maintain users’ existence in social web. All these specifications serve the same goal; being openly transparent about one’s interests on the Web in order to make the best use out of them for the user’s own benefit.

I'm currently thinking with my studdy-buddy Nikos Manouselis how we could save such attention profiles from different repositories to have a more holistic picture of what do users do on educational repositories or on federations of them. I think that alone would be a great advance for the research.

Second, it might be that the same user have profiles in different repositories (like I have one in MELT, in LeMill and OERCommons), so this would allow the user to consolidate her interests and resources found in different places, like bookmarks or collections that I have created in these different repositories. It could be nice to have my personal tagcloud based on my attentions in different repositories to allow me to access resources in these different services this way.

Third, there are resources that many of the educational repositories share. Like in MELT, we have most bookmarks on resources from LeMill. It is of interest for LeMill to know that they have fans and users in MELT, so this is the info that can be fed back from MELT to LeMill, and they can boost their stats with this! Not to mention of getting back the participatory information from MELT, e.g. users tags, ratings, etc.

The fourth advantage could be that using this type of profiled information to see what resources from LeMill have been of use to the "extended community" (e.g. outside of LeMill's own user base). This info could help them to boost their reputation in the network of repositories. If we knew that half of the repositories in the federation actually have users who interact with LeMill resources, that would give LeMill a great boost as an interesting repository to play with, a reputable provider of resources (someone pointed out this saying, hey, think of eBay's reputation points for sellers!). I already had toyed with the idea of "travel well" value for each repository in the federation based on the evidence of previous cross-border use of their resources (of course tracked down using something like portable profile).

Of course, finally, such thing could be used for recommendation purposes and to allow users swiftly find resources of interest without noticing that they have to go to a different repository. Like the previous idea of cross-repository tag clouds.


[1] AttentionXML (2004). AttentionXML specifications, Retrieved June 8, 2007, from http://developers.technorati.com/ wiki/attentionxml.
[2] Najjar, J., Wolpers, M., & Duval, E. (2006a), Attention Metadata: Collection and Management. Paper presented at the World Wide Web 2006 Workshop Logging Traces of Web Activity: The Mechanics of Data Collection, May 23, 2006, Edinburgh, UK.
[3] Najjar, J., Wolpers, M., & Duval, E. (2006b). Towards Effective Usage-Based Learning Applications: Track and Learn from User Experience(s). Paper presented at the IEEE International Conference on Advanced Learning Technologies (ICALT 2006), July 5-7, 2006, Kerkrade, The Netherlands.

Friday, May 30, 2008

Visualising networks of learning resources

I'm looking at the first dataset of bookmarks from MELT portal. Here you can see some of the first descriptions created by using Many Eyes. Click on the interact button in the pic and it loads. This is a treemap visualisation of the bookmarks that users so far have found.

What do you see here? You first see boxes in different colours. They are "boxed" by the user IDs. The bigger one is, the more learning resources this person has bookmarked. If you hoover your mouse over the boxes, you can see the ID of resources. These, of course, do not mean nothing to you now, but imagine if they were links to resources?

Next you can explore the data a bit further. Drag the mother tongue box on the top of the graph to the first place. Now, the boxes are displayed by the languages spoken by users. You'll see that Hungarian speakers have been busy on the portal, they have the most bookmarks.

Third, you can explore further by dragging the obj_lang to the first place. This shows the languages in which the bookmarked resources are. Interestingly, it turns out, most of these resources are in English. However, the diversity is there to be observed: users have found resources in many different languages useful.

Let's go further. The next one is a network diagram. If you click on "click to interact" you can also zoom into the visualisation.

What do you see here? It's a network that consist of: user mother tongue and the learning resource that those users bookmarked on the portal. You see 4 quite big vertices, which are the mother tongues of the users.
..network consists of a set of objects called vertices connected by edges. The visualization of the network is optimized to keep strongly related items in close proximity to each other. In this way, the overall arrangement of vertices in the network is very telling of the structure of the connections between vertices (vertices that are far away are weakly related to each other).In this visualization, the size of a vertex is proportional to the number of edges emanating from it.
Take the Hungarian speakers, for example. They are the ones who user the portal most, and have actually bookmarked a fair amount of resource. At the end of each edge you can see an ID number. Those are the ID of learning resources that these teachers have bookmarked. The same goes for Finnish speakers, Dutch speakers, etc.

Interestingly, we can see from this visualisation that not many resources are shared among the users from different language groups. A few are, though: take, for example, the LeMill resource that is visualised in orange in the image here. It has edges linking it to Finnish, German and Hungarian speakers. I counted 14 resources in this small dataset that were shared by users from different countries, that's about 13% of resources.

This type of resources are what we call "travel well" resources, as they can cross borders. In this case those borders are lingual. The resource also acts as a bridge between these different language communities. If you look at the resource in question, you'll find that it is to teach English (as
foreign language) and it is in English. Thus, it is not that surprising that it is well accepted in many language communities.

Finally, I also visualised the languages of learning resources instead of the resource ID. You can find it here. As you see from the image on the right, I have highlighted the languages of resources from Dutch speaking users. They have been pretty busy finding resources in all kinds of languages!

Tuesday, May 20, 2008

Call: WORKSHOP ON SOCIAL INFORMATION RETRIEVAL FOR TECHNOLOGY ENHANCED LEARNING (SIRTEL'08)

Good news, we are ready to roll out the call for contributions for our 2nd workshop! This time we are planning more time for discussions and brainstroming type of exercises that participants can lead! This was the feedback from last year, so you see that we are taking it seriously :)

Check out the format for contributions; Research papers and System Demos are the more conventional stuff that we welcome, whereas Hands-On proposals are there to let us all loose and to think how could we use ideas from some exiting, existing systems to enhance and support learning and teaching. Oh then, there are of course the Pecha Kucha talks. That makes me really curious: someone said that they would not really work with computer science. I hope we are able to prove that wrong ;)


WORKSHOP ON SOCIAL INFORMATION RETRIEVAL FOR TECHNOLOGY ENHANCED LEARNING (link)

in the 3rd European Conference on Technology Enhanced Learning (EC-TEL08), Maastricht, The Netherlands

IMPORTANT DATES

  • Contribution Submission: June 29, 2008
  • Results Notification: August 3, 2008
  • Camera Ready Submission: August 31, 2008
  • Workshop date: September 17, 2008
  • Main conference dates: September 18-19, 2008

CALL FOR WORKSHOP CONTRIBUTIONS

After the successful first SIRTEL workshop last year, we are delighted to welcome
exciting new contributions for the 2nd Social Information Retrieval for Technology Enhanced Learning (SIRTEL) workshop:

  • Research papers
  • System Demos
  • Hands-On proposals
  • "Pecha Kucha" talks*


RATIONALE

Learning and teaching resources are available on the Web - both in terms of digital learning
content and people resources (e.g. other learners, experts, tutors). They can be used to
facilitate teaching and learning tasks. Developing, deploying and
evaluating Social information retrieval (SIR) methods, techniques and systems that provide
learners and teachers with guidance in potentially overwhelming variety of choices remains to be tackled.

The aim of the SIRTEL’08 workshop is to look onward beyond recent achievements to discuss
specific topics, emerging research issues, new trends and endeavors in SIR for Technology Enhanced Learning (TEL). The
workshop will bring together researchers and practitioners to present, and more importantly,
to discuss the current status of research in SIR and TEL and its implications for science
and teaching.


TOPICS OF INTEREST (but not limited to):


Technology Enhanced Learning (TEL) and Social Information Retrieval (SIR) techniques such as:

  • Recommender systems
  • Social collaborative searching, browsing and sharing of queries
  • Social network analysis
  • Game-theoretic approaches to select learning materials and learning partners in the long tail
  • Social bookmarking and tagging, folksonomies
  • Annotations, ratings and evaluations


Concepts for Social Information Retrieval (SIR)

  • Defining the scope, purpose and objects of social information retrieval in TEL
  • Defining user requirements for the deployment of SIR systems in a learning setting
  • Current and new trends in SIR methods for TEL
  • Approaches to TEL metadata that reflect social ties and collaborative experiences in the field of education
  • Analytical modelling of strategic intentions in TEL communities
  • Interoperability of SIR systems for TEL


Implementation of SIR in TEL

  • Methods and models of SIR in the area of learning and teaching
  • Social processes and metaphors in learning communities and social networks for searching, acquiring and sharing information
  • Pedagogical aspects of SIR in TEL; how to scaffold students, activity patterns, etc.
  • Integrating SIR services in existing learning platforms
  • Visualisation techniques to support SIR in TEL
  • Successful scaffolding techniques for SIR implementation

Evaluation of SIR in TEL

  • Ideas on how can we get more empirical on evaluation
  • Best practices
  • Evaluation of the success and acceptance of SIR systems in the context of teaching,learning and/or TEL community building
  • Challenges and enablers
  • Evaluating the performance and measuring the effectiveness of SIR systems in learning applications;
  • Evaluation the user satisfaction with SIR system in supporting learning and teaching, etc.


WORKSHOP SUBMISSIONS

This year we base our call for contributions on last year’s comments, where the participants wanted more time for discussions, for picking each other’s brains and to forecast how SIR could be used in TEL. Apart from more conventional contributions, we also have new formats for you to consider!

  • Research papers (4-8 pages)
    to present exciting new work that is not mature enough for a long conference/journal paper. We especially value papers with focus on evaluating early results and making them available for further discussion among practitioners.

  • Work in progress and System demos (upto 4 pages)
    allow participants to share the basics of their SIR for TEL applications. Papers can be short (upto 4 pages), but also different ways using screencasting or YouTube-type recordings of the demo are welcome. Include also information also needed on how others can access your system and test it.

  • Hands-On proposals (1-pager)
    Got a good idea for a SIRTEL implementation? Toying with ideas for SIRTEL prototypes, either totally new ones or based on some existing application (e.g. Amazon, Flickr, Digg, ..)? Interested in “pimping-up” your current LMS or platform to support social networks?
    Create a little scenario and write it down so that others can follow your thinking. Put in a few screen shots to illustrate your point better. During the session, which you will lead, the participants will have their hands and brains-on your idea. The outcome will help you with requirements of implementations in a TEL setting. Early ideas welcome!

  • Abstract for Pecha Kucha (5 min talk)
    Want to share your discussion ideas on SIRTEL concepts with others? We are listening! To leverage on the face-to-face of the workshop, we invite you to submit an abstract for CP type of presentation-discussion moment which you will lead during the workshop. Your talk can be max. 4 minutes long, the participants will decide how much discussion will follow.


Papers are to be submitted to: https://togather.eu/handle/123456789/274
Accepted papers will be published online as EC-TEL workshop proceedings
as part of the CEUR Workshop proceedings series.

The two best papers of the workshop will be published in a special issue of
the International Journal of Technology-Enhanced Learning (IJTEL)
http://www.inderscience.com/browse/index.php?journalCODE=ijtel

More information at the submission site. All questions and submissions should be sent to: sirtel @ cs.kuleuven.be


PROGRAM COMMITTEE

  • Alexander Felfernig, University of Klagenfurt, Germany
  • Barry Smyth, University College Dublin, Ireland
  • Brandon Muramatsu, Utah State University, USA
  • Clemens Cap, University of Rostock, TBC
  • Frans van Assche, European Schoolnet, Belgium
  • Fridolin Wild, Vienna University of Economics and Business Administration, Austria
  • Hendrik Drachsler, Open University of the Netherlands, The Netherlands
  • Jon Dron, Athabasca University, Canada
  • Lisa Petrides, ISKME, USA
  • Marc Spaniol, Max-Planck-Institute for Informatics, Germany
  • Markus Strohmaier, Technical University of Graz, TBC
  • Martin Memmel, DFKI, Germany
  • Wolpers, Fraunhofer, Germany
  • Miguel-Angel Sicilia, University of Alcala, Spain
  • Nikos Manouselis. Greek Research & Technology Network, Greece
  • Oliver Bohl, Accenture GmbH, Germany
  • Rick D. Hangartner, MyStrands, USA
  • Selmin Nurcan, University of Paris 1, France
  • Yiwei Cao, RWTH Aachen University, Germany

ORGANISERS

  • Riina Vuorikari, Katholieke Universiteit Leuven (K.U.Leuven) & European Schoolnet (EUN), Belgium
  • Barbara Kieslinger, Centre for Social Innovation (ZSI), Austria
  • Ralf Klamma, RWTH Aachen University, Germany
  • Prof. Erik Duval, Katholieke Universiteit Leuven (K.U.Leuven), Belgium & ARIADNE Foundation

Tuesday, May 13, 2008

Mine/d your data

I just participated in a week-long datamining course at the university. It was hard work, but actually a lot of fun. We plowed thorough a lot of things; including association rules, clustering, logistic regression, decision trees, neural networks, and also learned, well, made acquaintance with, some of the dataminging software like SAS Entreprise miner and used MatLab to check out the neural networks. What a strange world.

In one exercise we used the German credit dataset and wanted to come up with a decision tree to sort out the bad customers from the good ones. After lots of clicking and choosing values and setting roles, we came up with a tree that had an error rate of 47%. Wow. As well the banker could just flip a coin to choose which customer to give credit and whom not. Ok, probably a bad example, we did learn after that about the cost of misclassification, so we were able to make something better. But anyway, it just kind of made me laugh.

I was reading this blog and came across this interesting information about datamining methods that "miners" choose to use. Now that I know what all those words mean, this became an interesting piece of information for me :)

• Correspondingly, the most commonly used algorithms are regression (79 percent), decision trees (77 percent) and cluster analysis (72 percent). Again, this reflects what we have seen in our own work. Regression certainly remains the algorithm of choice for large sections of the academic community and within the financial services sector. More and more data miners, however, are using decision trees, and cluster analysis has long been the bedrock of the marketing community.
I personally thought that most useful techniques for me could be mining association rules, clustering analysis and maybe the use of decision trees. To be seen.

What I was actually pretty amazed about was that Datamining is very related to predicting missing values, i.e. the same methods that many recommender systems/studies use to predict the missing values of ratings. Another thing which was totally new was that Datamining and Machine learning are actually very related, well, quasi-overlapping, I guess.

Wednesday, April 02, 2008

My PhD dissertation, a new take on defining it

How Social Information Retrieval (SIR) can be used to enhance the discovery of large-scale collections of multilingual digital learning resources

The PhD dissertation deals with the discovery of digital learning resources and flexible access to large-scale collections of multilingual digital educational content. The thesis attempts to prove that we can use information deduced from social bookmarks and tags to better select suitable learning resources to users, who come from a variety of countries, speak different languages and whose educational context vary.

The first step towards proving this thesis statement is to better understand whether there are digital learning resources that afford a good usage also in a context other than the one they were originally intended for. We call this type of educational content “travel well” resources because they cross borders easily; those borders can be national, linguistic, educational or socio-cultural.

Upon better understanding of how users agree on “travel well” resources, we can explore the ways to identify them. Two different sources of information can be used for this purpose: looking at the properties of these resources (e.g. Learning Object Metadata), as well as attentional metadata collected from users interactions with the resources on the portal (Najjar, 2006). Our interest is in attentional metadata that we can gather from users' social bookmarks, from their personal collections of educational resources that they create, and from tags that they add to these resources (Vuorikari and Van Assche, 2007, Vuorikari et Poldoja, submitted).

One major contribution of this thesis is the better understanding of how users (e.g. teachers) tag educational resources in a multilingual environment and whether a multilingual context has any implication on the tagging behaviour (e.g. in what languages do users tag) (Vuorikari, et al., submitted). Secondly, we are interested in the value that a multilingual tagging system provides; on the one hand, we want to know what kind of information multilingual tags can yield about the resources and their possible use in different contexts. On the other hand, we are interested in their value for resource discovery and as a navigational tool to allow cross-language and country exploration of new resources in multiple languages.

Better understanding of tagging behaviour and creation of personal collections of learning resources will help us to create metrics that can be used to calculate “travel well” value of resource. Our hypothesis is that we can define a “travel well” resource when we use information deduced from social bookmarks, users’ personal collections of educational resources, and from tags that they have added to these resources. We will be watching the following variables:
  • The resource is from a different country than the user is
  • The resource is in a different language than user’s mother tongue,
  • The resource has tags in different language(s) than that of the item language
The metrics used to calculate the “travel well” value of digital learning resources would be used to create a TravelRank algorithm that allows identifying learning resources that “travel well”, and which can be used to compliment the LearnRank algorithm (Duval, 2006). Identifying these resources from large collections of digital learning content from different countries and in different languages has a potential to allow a more flexible access to large-scale collections of resources. The final part of the thesis is to validate this claim and to evaluate its usefulness for a large audience of users from different countries.
References:

Najjar J., Wolpers M., and Duval E. Towards Effective Usage-Based Learning Applications: Track and Learn from User Experience(s). IEEE International Conference on Advanced Learning Technologies, (2006) (ICALT '06).

Duval E. LearnRank: Towards a real quality measure for Learning. In U. Ehlers & J.M. Pawlowski (eds.), European Handbook for Quality and Standardization in E-Learning. Springer (2006), 379-384.

other non-published, submitted papers at my site:
http://www.cs.kuleuven.be/~riina/

Friday, March 28, 2008

Facebook "You Suck" app, aka. the real world version of "People You May Know"

Some time ago I was joking with some of my studdy-buddies about the happy world of Facebook. Everything is so great, you can have nice things said about you by your friends, etc. It was about the time to make things more realistic, hence the conceptual design of "You Suck" application.

The concept would be based on the recently added "People You May Know" feature, the same one that has been on LinkedIn for quite some time now. You know, the freaky list of people that you "should" connect with, because they happen to be on the list of your friends, or friends-of-your-friends? I am actually pretty amazed how well LinkedIn has been able to make it work, it's almost freaky to see some ghosts from the past re-appearing.

The idea of "You Suck" app is that there is a reason why those people are not on your friends' list. You may not want to have them "friend" you on Facebook! Hello, anyone thought of that?!

So, the "You Suck" app would use the list of "People You May Know". Then, let's say Brian would be on the top of my list, begging me to connect to him. After all, he is already friend with 5 of my friends. Then there would be Mary, Ann, etc.

Now, it's time to calculate the "You Suck" value for Brian. From me, he gets 5 "You Suck" points. Brian might be on the "People You May Know" list from some other people too. So, similarly, we would count those values and add them up.

Then, next time when Brian logs in to his Facebook account, among other nice and positive things about the world, he will be able to check how much he sucks to me and other People He May Know.

Now, talking about a killer app?
Facebook has quietly rolled out a new feature called “People You May Know”, which, as the names suggests, attempts to identify members of the social networking site who you likely know but haven’t actually “connected” with yet i.e. invited to be a “friend.” ZDNet

Friday, March 21, 2008

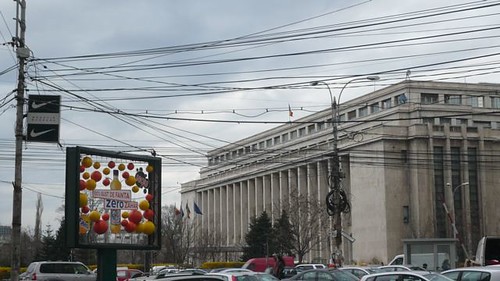
Reflections on Romania

I usually try to think of at least 3 things to take home with me from a new country, but now only 2 comes up from Romania. Romania, by the way, is the 44th country that I visit, making me have seen only 19% of the countries in the world. Still quite some way to go!

  • The first and last thing that you notice about Bucharest are the cars everywhere. Like many other merging nation, the biggest status symbol is owning a (new) car. My knowledgeable source of information (again a taxi driver), told that there is 800% growth in cars since 90's, that is the end of Ceausescu's regime. I bet that, as megalomaniac as he was (built the 2nd largest administrative building in the world for his comrades of the Communist party), he could not have foreseen the growth and build his road infrastructure accordingly.

    Example, I was not advised to take a taxi before 9pm to avoid the evening rush-hour (from 4 to 9pm!). Just imagine the time the Romanians have to waste in traffic jams every day!

  • The language is intriguing! I did not get hardly anything while listening ppl to talk, but when you see it written, there are so many romanic words that you are bound to make some sense of it. However, they disguise the language well by using all the Slavic looking signs (^), so it's not easily recognisable.

Friday, March 14, 2008

Hole in the wall-experiment and eTwinning

The eTwinning conference is just kicked-off by the Commissionaire Figel here in Bucarest.

I'm very exited to hear the keynote speaker Dr. Sugata Mitra who will speak in a few hours. He is the one who made the most exiting (OK, that's my idea of it) experiment with kids and computers, namely, made a "hole" in a wall at the slum in Delhi to allow unprivileged kids to access computers and the Internet. He came up with something that he calls "Minimal Invasive Education", which allows kids to learn without formal instruction.

So, more about him later, I already had a chance to have a beer with him last night, but I'm really looking forward to some more question time with him. I saw that Downes talked very highly about one of his previous speeches.

Tomorrow I will have 3 workshops in a row to talk about social bookmarking and social tagging with teachers.

´´´´´´´´´´´´´´´´´´´´´´
Update: I have blogged about the speech at FlossePosse the audio of his excellent (!!) keynote is available there too. Dr. Mitra is so inspiring that you just want to leave everything that you are doing now and start working for him!

Tuesday, February 26, 2008

Mashing up Crashes, Fires and Crime


I came across this news outlet and found an "interesting" Google map mash-up with local police reports of Crashes, Fires and Crimes around the region. Instead of only reading this (useless) information in a report, you can now visualise in which neighbourhood the crime took place.

I'm left somewhat speechless..