Friday, May 30, 2008

Visualising networks of learning resources

I'm looking at the first dataset of bookmarks from MELT portal. Here you can see some of the first descriptions created by using Many Eyes. Click on the interact button in the pic and it loads. This is a treemap visualisation of the bookmarks that users so far have found.

What do you see here? You first see boxes in different colours. They are "boxed" by the user IDs. The bigger one is, the more learning resources this person has bookmarked. If you hoover your mouse over the boxes, you can see the ID of resources. These, of course, do not mean nothing to you now, but imagine if they were links to resources?

Next you can explore the data a bit further. Drag the mother tongue box on the top of the graph to the first place. Now, the boxes are displayed by the languages spoken by users. You'll see that Hungarian speakers have been busy on the portal, they have the most bookmarks.

Third, you can explore further by dragging the obj_lang to the first place. This shows the languages in which the bookmarked resources are. Interestingly, it turns out, most of these resources are in English. However, the diversity is there to be observed: users have found resources in many different languages useful.

Let's go further. The next one is a network diagram. If you click on "click to interact" you can also zoom into the visualisation.

What do you see here? It's a network that consist of: user mother tongue and the learning resource that those users bookmarked on the portal. You see 4 quite big vertices, which are the mother tongues of the users.
..network consists of a set of objects called vertices connected by edges. The visualization of the network is optimized to keep strongly related items in close proximity to each other. In this way, the overall arrangement of vertices in the network is very telling of the structure of the connections between vertices (vertices that are far away are weakly related to each other).In this visualization, the size of a vertex is proportional to the number of edges emanating from it.
Take the Hungarian speakers, for example. They are the ones who user the portal most, and have actually bookmarked a fair amount of resource. At the end of each edge you can see an ID number. Those are the ID of learning resources that these teachers have bookmarked. The same goes for Finnish speakers, Dutch speakers, etc.

Interestingly, we can see from this visualisation that not many resources are shared among the users from different language groups. A few are, though: take, for example, the LeMill resource that is visualised in orange in the image here. It has edges linking it to Finnish, German and Hungarian speakers. I counted 14 resources in this small dataset that were shared by users from different countries, that's about 13% of resources.

This type of resources are what we call "travel well" resources, as they can cross borders. In this case those borders are lingual. The resource also acts as a bridge between these different language communities. If you look at the resource in question, you'll find that it is to teach English (as
foreign language) and it is in English. Thus, it is not that surprising that it is well accepted in many language communities.

Finally, I also visualised the languages of learning resources instead of the resource ID. You can find it here. As you see from the image on the right, I have highlighted the languages of resources from Dutch speaking users. They have been pretty busy finding resources in all kinds of languages!

Tuesday, May 20, 2008

Call: WORKSHOP ON SOCIAL INFORMATION RETRIEVAL FOR TECHNOLOGY ENHANCED LEARNING (SIRTEL'08)

Good news, we are ready to roll out the call for contributions for our 2nd workshop! This time we are planning more time for discussions and brainstroming type of exercises that participants can lead! This was the feedback from last year, so you see that we are taking it seriously :)

Check out the format for contributions; Research papers and System Demos are the more conventional stuff that we welcome, whereas Hands-On proposals are there to let us all loose and to think how could we use ideas from some exiting, existing systems to enhance and support learning and teaching. Oh then, there are of course the Pecha Kucha talks. That makes me really curious: someone said that they would not really work with computer science. I hope we are able to prove that wrong ;)


WORKSHOP ON SOCIAL INFORMATION RETRIEVAL FOR TECHNOLOGY ENHANCED LEARNING (link)

in the 3rd European Conference on Technology Enhanced Learning (EC-TEL08), Maastricht, The Netherlands

IMPORTANT DATES

  • Contribution Submission: June 29, 2008
  • Results Notification: August 3, 2008
  • Camera Ready Submission: August 31, 2008
  • Workshop date: September 17, 2008
  • Main conference dates: September 18-19, 2008

CALL FOR WORKSHOP CONTRIBUTIONS

After the successful first SIRTEL workshop last year, we are delighted to welcome
exciting new contributions for the 2nd Social Information Retrieval for Technology Enhanced Learning (SIRTEL) workshop:

  • Research papers
  • System Demos
  • Hands-On proposals
  • "Pecha Kucha" talks*


RATIONALE

Learning and teaching resources are available on the Web - both in terms of digital learning
content and people resources (e.g. other learners, experts, tutors). They can be used to
facilitate teaching and learning tasks. Developing, deploying and
evaluating Social information retrieval (SIR) methods, techniques and systems that provide
learners and teachers with guidance in potentially overwhelming variety of choices remains to be tackled.

The aim of the SIRTEL’08 workshop is to look onward beyond recent achievements to discuss
specific topics, emerging research issues, new trends and endeavors in SIR for Technology Enhanced Learning (TEL). The
workshop will bring together researchers and practitioners to present, and more importantly,
to discuss the current status of research in SIR and TEL and its implications for science
and teaching.


TOPICS OF INTEREST (but not limited to):


Technology Enhanced Learning (TEL) and Social Information Retrieval (SIR) techniques such as:

  • Recommender systems
  • Social collaborative searching, browsing and sharing of queries
  • Social network analysis
  • Game-theoretic approaches to select learning materials and learning partners in the long tail
  • Social bookmarking and tagging, folksonomies
  • Annotations, ratings and evaluations


Concepts for Social Information Retrieval (SIR)

  • Defining the scope, purpose and objects of social information retrieval in TEL
  • Defining user requirements for the deployment of SIR systems in a learning setting
  • Current and new trends in SIR methods for TEL
  • Approaches to TEL metadata that reflect social ties and collaborative experiences in the field of education
  • Analytical modelling of strategic intentions in TEL communities
  • Interoperability of SIR systems for TEL


Implementation of SIR in TEL

  • Methods and models of SIR in the area of learning and teaching
  • Social processes and metaphors in learning communities and social networks for searching, acquiring and sharing information
  • Pedagogical aspects of SIR in TEL; how to scaffold students, activity patterns, etc.
  • Integrating SIR services in existing learning platforms
  • Visualisation techniques to support SIR in TEL
  • Successful scaffolding techniques for SIR implementation

Evaluation of SIR in TEL

  • Ideas on how can we get more empirical on evaluation
  • Best practices
  • Evaluation of the success and acceptance of SIR systems in the context of teaching,learning and/or TEL community building
  • Challenges and enablers
  • Evaluating the performance and measuring the effectiveness of SIR systems in learning applications;
  • Evaluation the user satisfaction with SIR system in supporting learning and teaching, etc.


WORKSHOP SUBMISSIONS

This year we base our call for contributions on last year’s comments, where the participants wanted more time for discussions, for picking each other’s brains and to forecast how SIR could be used in TEL. Apart from more conventional contributions, we also have new formats for you to consider!

  • Research papers (4-8 pages)
    to present exciting new work that is not mature enough for a long conference/journal paper. We especially value papers with focus on evaluating early results and making them available for further discussion among practitioners.

  • Work in progress and System demos (upto 4 pages)
    allow participants to share the basics of their SIR for TEL applications. Papers can be short (upto 4 pages), but also different ways using screencasting or YouTube-type recordings of the demo are welcome. Include also information also needed on how others can access your system and test it.

  • Hands-On proposals (1-pager)
    Got a good idea for a SIRTEL implementation? Toying with ideas for SIRTEL prototypes, either totally new ones or based on some existing application (e.g. Amazon, Flickr, Digg, ..)? Interested in “pimping-up” your current LMS or platform to support social networks?
    Create a little scenario and write it down so that others can follow your thinking. Put in a few screen shots to illustrate your point better. During the session, which you will lead, the participants will have their hands and brains-on your idea. The outcome will help you with requirements of implementations in a TEL setting. Early ideas welcome!

  • Abstract for Pecha Kucha (5 min talk)
    Want to share your discussion ideas on SIRTEL concepts with others? We are listening! To leverage on the face-to-face of the workshop, we invite you to submit an abstract for CP type of presentation-discussion moment which you will lead during the workshop. Your talk can be max. 4 minutes long, the participants will decide how much discussion will follow.


Papers are to be submitted to: https://togather.eu/handle/123456789/274
Accepted papers will be published online as EC-TEL workshop proceedings
as part of the CEUR Workshop proceedings series.

The two best papers of the workshop will be published in a special issue of
the International Journal of Technology-Enhanced Learning (IJTEL)
http://www.inderscience.com/browse/index.php?journalCODE=ijtel

More information at the submission site. All questions and submissions should be sent to: sirtel @ cs.kuleuven.be


PROGRAM COMMITTEE

  • Alexander Felfernig, University of Klagenfurt, Germany
  • Barry Smyth, University College Dublin, Ireland
  • Brandon Muramatsu, Utah State University, USA
  • Clemens Cap, University of Rostock, TBC
  • Frans van Assche, European Schoolnet, Belgium
  • Fridolin Wild, Vienna University of Economics and Business Administration, Austria
  • Hendrik Drachsler, Open University of the Netherlands, The Netherlands
  • Jon Dron, Athabasca University, Canada
  • Lisa Petrides, ISKME, USA
  • Marc Spaniol, Max-Planck-Institute for Informatics, Germany
  • Markus Strohmaier, Technical University of Graz, TBC
  • Martin Memmel, DFKI, Germany
  • Wolpers, Fraunhofer, Germany
  • Miguel-Angel Sicilia, University of Alcala, Spain
  • Nikos Manouselis. Greek Research & Technology Network, Greece
  • Oliver Bohl, Accenture GmbH, Germany
  • Rick D. Hangartner, MyStrands, USA
  • Selmin Nurcan, University of Paris 1, France
  • Yiwei Cao, RWTH Aachen University, Germany

ORGANISERS

  • Riina Vuorikari, Katholieke Universiteit Leuven (K.U.Leuven) & European Schoolnet (EUN), Belgium
  • Barbara Kieslinger, Centre for Social Innovation (ZSI), Austria
  • Ralf Klamma, RWTH Aachen University, Germany
  • Prof. Erik Duval, Katholieke Universiteit Leuven (K.U.Leuven), Belgium & ARIADNE Foundation

Tuesday, May 13, 2008

Mine/d your data

I just participated in a week-long datamining course at the university. It was hard work, but actually a lot of fun. We plowed thorough a lot of things; including association rules, clustering, logistic regression, decision trees, neural networks, and also learned, well, made acquaintance with, some of the dataminging software like SAS Entreprise miner and used MatLab to check out the neural networks. What a strange world.

In one exercise we used the German credit dataset and wanted to come up with a decision tree to sort out the bad customers from the good ones. After lots of clicking and choosing values and setting roles, we came up with a tree that had an error rate of 47%. Wow. As well the banker could just flip a coin to choose which customer to give credit and whom not. Ok, probably a bad example, we did learn after that about the cost of misclassification, so we were able to make something better. But anyway, it just kind of made me laugh.

I was reading this blog and came across this interesting information about datamining methods that "miners" choose to use. Now that I know what all those words mean, this became an interesting piece of information for me :)

• Correspondingly, the most commonly used algorithms are regression (79 percent), decision trees (77 percent) and cluster analysis (72 percent). Again, this reflects what we have seen in our own work. Regression certainly remains the algorithm of choice for large sections of the academic community and within the financial services sector. More and more data miners, however, are using decision trees, and cluster analysis has long been the bedrock of the marketing community.
I personally thought that most useful techniques for me could be mining association rules, clustering analysis and maybe the use of decision trees. To be seen.

What I was actually pretty amazed about was that Datamining is very related to predicting missing values, i.e. the same methods that many recommender systems/studies use to predict the missing values of ratings. Another thing which was totally new was that Datamining and Machine learning are actually very related, well, quasi-overlapping, I guess.

Wednesday, April 02, 2008

My PhD dissertation, a new take on defining it

How Social Information Retrieval (SIR) can be used to enhance the discovery of large-scale collections of multilingual digital learning resources

The PhD dissertation deals with the discovery of digital learning resources and flexible access to large-scale collections of multilingual digital educational content. The thesis attempts to prove that we can use information deduced from social bookmarks and tags to better select suitable learning resources to users, who come from a variety of countries, speak different languages and whose educational context vary.

The first step towards proving this thesis statement is to better understand whether there are digital learning resources that afford a good usage also in a context other than the one they were originally intended for. We call this type of educational content “travel well” resources because they cross borders easily; those borders can be national, linguistic, educational or socio-cultural.

Upon better understanding of how users agree on “travel well” resources, we can explore the ways to identify them. Two different sources of information can be used for this purpose: looking at the properties of these resources (e.g. Learning Object Metadata), as well as attentional metadata collected from users interactions with the resources on the portal (Najjar, 2006). Our interest is in attentional metadata that we can gather from users' social bookmarks, from their personal collections of educational resources that they create, and from tags that they add to these resources (Vuorikari and Van Assche, 2007, Vuorikari et Poldoja, submitted).

One major contribution of this thesis is the better understanding of how users (e.g. teachers) tag educational resources in a multilingual environment and whether a multilingual context has any implication on the tagging behaviour (e.g. in what languages do users tag) (Vuorikari, et al., submitted). Secondly, we are interested in the value that a multilingual tagging system provides; on the one hand, we want to know what kind of information multilingual tags can yield about the resources and their possible use in different contexts. On the other hand, we are interested in their value for resource discovery and as a navigational tool to allow cross-language and country exploration of new resources in multiple languages.

Better understanding of tagging behaviour and creation of personal collections of learning resources will help us to create metrics that can be used to calculate “travel well” value of resource. Our hypothesis is that we can define a “travel well” resource when we use information deduced from social bookmarks, users’ personal collections of educational resources, and from tags that they have added to these resources. We will be watching the following variables:
  • The resource is from a different country than the user is
  • The resource is in a different language than user’s mother tongue,
  • The resource has tags in different language(s) than that of the item language
The metrics used to calculate the “travel well” value of digital learning resources would be used to create a TravelRank algorithm that allows identifying learning resources that “travel well”, and which can be used to compliment the LearnRank algorithm (Duval, 2006). Identifying these resources from large collections of digital learning content from different countries and in different languages has a potential to allow a more flexible access to large-scale collections of resources. The final part of the thesis is to validate this claim and to evaluate its usefulness for a large audience of users from different countries.
References:

Najjar J., Wolpers M., and Duval E. Towards Effective Usage-Based Learning Applications: Track and Learn from User Experience(s). IEEE International Conference on Advanced Learning Technologies, (2006) (ICALT '06).

Duval E. LearnRank: Towards a real quality measure for Learning. In U. Ehlers & J.M. Pawlowski (eds.), European Handbook for Quality and Standardization in E-Learning. Springer (2006), 379-384.

other non-published, submitted papers at my site:
http://www.cs.kuleuven.be/~riina/

Friday, March 28, 2008

Facebook "You Suck" app, aka. the real world version of "People You May Know"

Some time ago I was joking with some of my studdy-buddies about the happy world of Facebook. Everything is so great, you can have nice things said about you by your friends, etc. It was about the time to make things more realistic, hence the conceptual design of "You Suck" application.

The concept would be based on the recently added "People You May Know" feature, the same one that has been on LinkedIn for quite some time now. You know, the freaky list of people that you "should" connect with, because they happen to be on the list of your friends, or friends-of-your-friends? I am actually pretty amazed how well LinkedIn has been able to make it work, it's almost freaky to see some ghosts from the past re-appearing.

The idea of "You Suck" app is that there is a reason why those people are not on your friends' list. You may not want to have them "friend" you on Facebook! Hello, anyone thought of that?!

So, the "You Suck" app would use the list of "People You May Know". Then, let's say Brian would be on the top of my list, begging me to connect to him. After all, he is already friend with 5 of my friends. Then there would be Mary, Ann, etc.

Now, it's time to calculate the "You Suck" value for Brian. From me, he gets 5 "You Suck" points. Brian might be on the "People You May Know" list from some other people too. So, similarly, we would count those values and add them up.

Then, next time when Brian logs in to his Facebook account, among other nice and positive things about the world, he will be able to check how much he sucks to me and other People He May Know.

Now, talking about a killer app?
Facebook has quietly rolled out a new feature called “People You May Know”, which, as the names suggests, attempts to identify members of the social networking site who you likely know but haven’t actually “connected” with yet i.e. invited to be a “friend.” ZDNet

Friday, March 21, 2008

Reflections on Romania

I usually try to think of at least 3 things to take home with me from a new country, but now only 2 comes up from Romania. Romania, by the way, is the 44th country that I visit, making me have seen only 19% of the countries in the world. Still quite some way to go!

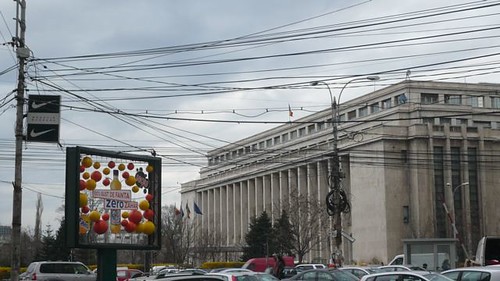
  • The first and last thing that you notice about Bucharest are the cars everywhere. Like many other merging nation, the biggest status symbol is owning a (new) car. My knowledgeable source of information (again a taxi driver), told that there is 800% growth in cars since 90's, that is the end of Ceausescu's regime. I bet that, as megalomaniac as he was (built the 2nd largest administrative building in the world for his comrades of the Communist party), he could not have foreseen the growth and build his road infrastructure accordingly.

    Example, I was not advised to take a taxi before 9pm to avoid the evening rush-hour (from 4 to 9pm!). Just imagine the time the Romanians have to waste in traffic jams every day!

  • The language is intriguing! I did not get hardly anything while listening ppl to talk, but when you see it written, there are so many romanic words that you are bound to make some sense of it. However, they disguise the language well by using all the Slavic looking signs (^), so it's not easily recognisable.

Friday, March 14, 2008

Hole in the wall-experiment and eTwinning

The eTwinning conference is just kicked-off by the Commissionaire Figel here in Bucarest.

I'm very exited to hear the keynote speaker Dr. Sugata Mitra who will speak in a few hours. He is the one who made the most exiting (OK, that's my idea of it) experiment with kids and computers, namely, made a "hole" in a wall at the slum in Delhi to allow unprivileged kids to access computers and the Internet. He came up with something that he calls "Minimal Invasive Education", which allows kids to learn without formal instruction.

So, more about him later, I already had a chance to have a beer with him last night, but I'm really looking forward to some more question time with him. I saw that Downes talked very highly about one of his previous speeches.

Tomorrow I will have 3 workshops in a row to talk about social bookmarking and social tagging with teachers.

´´´´´´´´´´´´´´´´´´´´´´
Update: I have blogged about the speech at FlossePosse the audio of his excellent (!!) keynote is available there too. Dr. Mitra is so inspiring that you just want to leave everything that you are doing now and start working for him!

Tuesday, February 26, 2008

Mashing up Crashes, Fires and Crime


I came across this news outlet and found an "interesting" Google map mash-up with local police reports of Crashes, Fires and Crimes around the region. Instead of only reading this (useless) information in a report, you can now visualise in which neighbourhood the crime took place.

I'm left somewhat speechless..

Friday, January 25, 2008

Visualising tags from LORs

This tagcloud is comprised of all most used tags in 3 repositories.


Whereas this one is cleaned from tags that are shared with a specific community of users within one repository. Much better?


Or, should the tags be displayed by the biggest number of users, not how many times they have been applied?

Tuesday, January 15, 2008

You gotta be careful what you wish for: data portability group

I just read about the Data Portability group, or rather just watched the video (funky music!) on Read/Write web. Philosophy, like explained on http://dataportability.org/

Philosophy As users, our identity, photos, videos and other forms of personal data should be discoverable by, and shared between our chosen (and trusted) tools or vendors. We need a DHCP for Identity. A distributed File System for data. The technologies already exist, we simply need a complete reference design to put the pieces together.

Mission To put all existing technologies and initiatives in context to create a reference design for end-to-end Data Portability. To promote that design to the developer, vendor and end-user community.


A year ago, I posted about Fighting read/write web fatique. So, that's what all the traffic on my blog was about ;) (as if...)

Microsoft-free life is over for me?

When I was younger I always hated it when older folks could not remember when thinks happened. They would pause in a middle of a story and start "well, can't remember if it was '65 or '67...". I always thought that I would never do that, I always remember when things happened - or well, I used to.

So I had to go back to some old files on my old computer to find out when was it that I actually started my life without Microsoft. It was around the end of 2003 when the operating system on my ThinkPad crashed and did not boot anymore. Luckily I had a Mandrake distro installed on a separate partition, so I was able to access my files and go on working.

That incident gave me a good kick to keep experimenting with Linux on a desktop. It was quite a struggle in the beginning, as I refuse to use the command line and want to manage everything using a GUI. Installing new software was always a struggle, some dependencies were always missing, and I could never even get the installing thing working in Ubuntu. Yack.

Anyway, the point of the experiment was to know if an average Bob or Mary could use Linux on a desktop. At the time I was writing a lot in EUN about the use of open source software in education (see some reports here, I still like this one). I truly think they could. Especially when in many schools teachers and pupils cannot even have admin rights to the computer that they use, non of the installing issues would come up for the end-user. Using OO, Firefox and such is all jeu d'enfant.

Back to the title: a week ago I installed MS Office on my Mac. That's it, they won, after all these years! That's more than 4 years without Microsoft (i.e. Linux and Mac), which has been a real source of joy for me. I cannot articulate all points why I so dislike Microsoft, I think deep down it's the idea having one big guy on the playground (especially if it's not me ;).

Anyway, I'm giving it a try for a short while and see if it enhances my PhD writing. Maybe, now that I'll have all the fancy words in the Thesaurus (must admit OO's not the best), and I can start sounding much more intelligent and I'll get my PhD just with a little spin!

So far I'm not too thrilled. It crashes all the time, at least 5 to 10 times a day. It also uses all my RAM (I have 2 Gb now) and I cannot have all my usual apps open at the same time with Word and Excell without running real slowly. Oh yeah, and the user interface is god dam busy, I much prefer the serenity of OO.

The reason I gave up was that my OO, after the OS X upgrade, did not work properly anymore. I did not recognise the changes in the virtual keyboard (I switch between the Fi and Us all the time), and the spreadsheet did not recognise the control click (right click). Oh, and it was slow tooo! I later heard that my study-buddy has no problems with NeoOffice, but that'll be next on my list.

In Three Fearless Predictions (The Economist) talks nicely about "openness" in 2008 in terms of open source software on desktops (linux), iPhone being forced to open up in Germany and about how SCO seems to be gone ,once for all, with their silly lawsuits against companies developing Linux software. Maybe I'll get some of that openness too...

Sunday, January 06, 2008

My Photo in a travel guide: innovative use of Creative Commons

We often times hear about "innovative use of new technologies" or how "new licensing schemes offer innovative ways to use content". Unfortunately, too little of that is seen in the real life and too little of it comes to your way. This time I was happily surprised, though.

One of my travel photos on Flickr, which I always put a Creative Commons license on, was selected as a runner-up for an online travel guide. They contacted me through Flickr account and asked if I wanted to submit my photo into their Travel guide. Hell yes, I though, it would be fun to have one of my pics up.

My photo now is the main picture of Cafe Imperial, a cool Art Nouveau style cafe in Prague. I found the cafe a few years ago when in Prague, Matt and I had passed by it during the day and decided to go there for dinner. I had a really good Stroganoff, the one that has a true Russian flavour to it. It was a great dinner in a great place, and now I have a memory of it in a travel guide. Funny how things go!

Monday, December 31, 2007

End of the year account: travels

I decided to write an end of the year summary for myself about 2007. This is a personal account, so if you come across this, don't bother boring yourself with it.

It will include important things like my travels, studies and worklife. I'll do it so that I can look back and say, what the hell of a year it was. I bet there will be years that are not that gentle with me, so it'll be fun to dig this year up and read how things were once upon a time.

Start with travels, most important ;)

2007 was a good travel year. Like any wanna-be globetrotter, I managed to put my foot on a new continent this year. I also got to discover new pretty rare places and visited the usual ones, so it's a good count for 2007.

To start off, 2007 was going to be my EPIC ski year. I had a season pass to Winter Park in Colorado and I planned to spent some two months in Wyoming. After all, this was my last year on scholarship, so I had to make a good use of that freedom ;)

It turned out not to be an epic ski season. Not for the shake of snow this time, but for the fact that Matt broke his leg, pretty seriously, during our second weekend of skiing in Utah. Well then, I got some seven days in, though, and busted my dear snowboard after many faithful years of use. So, the best part of Q1 was spent in Wyoming and I also got to visit Utah, especially the LDS Memorial Hospital in Salt Lake City (Matt had his surgery there).

Beginning of June was the start of the great big sailing adventure (pics and blog). Oh my, that's gotta rank as one of the best trips ever. Matt and I took a flight to Rarotonga, Cook Islands, where we met with Dan and Danielle, who had sailed there from San Francisco via Mexico, French Polynesia and such.

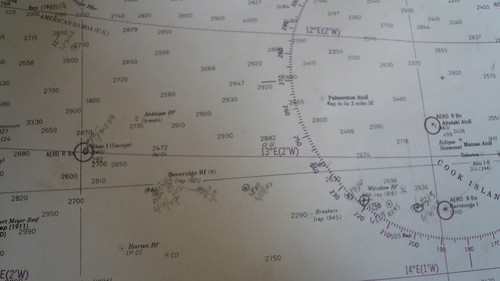
We boarded on Confetti, a beautiful 44-footer, a hand-grafted wooden boat (Farr), to sail for about 1200 sea miles. We spent some 3 weeks on and off board exploring Rarotonga, Beverage reef (wow, even Wikipedia does not have an entry for it!!), Nuie and American Samoa, all small tiny places in the vast South Pacific.

We put in a total of seven-eight days of off-shore sailing (in 3 legs), which is by far the longest time I've ever been out on the open. And I really mean out on the open, hell, those "trade wind" areas, there is no one out there! During the first leg from Raro to Beveragereef and Niue, which took about 10 days, we saw no one, no boats, no planes, nothing. Just us in Confetti with our Ham-radio connection to weather forecasts and some necessary emails. That was some experience that I'll keep cherishing for a long time.

Another curiosity of this trip was the type of "civilization" that we encountered when we stayed on those islands. First, I gotta admit that they are something to dream about; beautiful white beaches, palm trees, thick green vegetation and so on. Just what you would expect. Sadly, though, the life that people lead on these "paradise" islands is far from my notion of paradise. It seems that "civilization" from missionaries, and early and nowadays merchandisers and explorers has dramatically altered the way of life, and globalization with the help of satellite TV and subsidized food from New Zealand has taken over any tiny bit that was left of the original way of living.

It's hard to put words on what we saw without sounding like a "conservationist". I don't want to say that people should still live like they did when Captain Cook and other discoverers first met them. What I want to say is that it hurts seeing such level of obesity, unemployment and apathy against your own nature and environment on some of the most beautiful spots on earth that I've ever seen.

Apart from the South Pacific, this year's new discoveries include Cyprus. I finally got to see Barcelona, it's as great as people say it is!

I also got two trips on my miles, which is good.

Wednesday, December 12, 2007

I'm not a happy bunny with Leopard, grrr

Oh my, just gotta say this out loud! I'm not happy to have the new Leopard running on my Mac, really not :(

It's not that I'm very picky about things not working smoothly, after all, before switching back to Mac I ran only Linux on my desktop for about a year and a half. It wasn't always easy for a non techky user like me (I still get pimples if I have to use command line...), but I wanted to give it a try. After all, at that time I talked a lot about using FLOSS in education. So to know what to talk about, I needed to do it myself.

About Leopard. Last drop today was that I can not get one of my favourite widgets working, namely Screenshot plus. They claim they became Leopard compatible, but bullocks, it still does not work. And that is not the only thing!

My Mail crashes about five times a day, luckily still saving the email drafts. And that is a Mac native application, what the hec?? I also use OpenOffice, probably the only individual in the world to do it on Mac. But hey, after all I bought a Mac 'cause I did not want to use MS programmes.

So, OO became REALLY slow and it does not support all the keyboard shortcuts or virtual keyboard language selections (I use Finnish and US keyboard and switch a lot). This makes my work really sucky.

It's not actually only OO that became slow, it the whole computer. I constantly use all my virtual memory, 1.5Gb, which does not seem to be sufficient for this hungry animal. All the searches within the computer are really slow too.

Yes, also the Java support is inexistent, and I have no idea how to deal with that.

Well, I feel much better now. Thanks god there are blogs to vent out... whew..

Monday, November 19, 2007

eTwinning/bookmarks and social networks

Excellent write up here about SNA on social networking sites. This makes me think of eTwinning, or my social bookmarks, and the SNA analysis there to better support users.

Kumar, Novak and Tomkins (200&) saw that network activity is of three types:
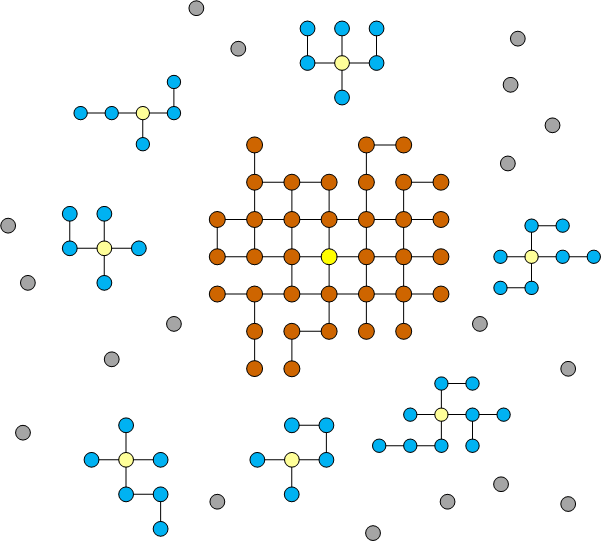
  • “Singletons,” who have no connections and are least central
  • The “giant component,” which is the largest group of nodes tightly connected to the central nodes and to each other
  • The “middle region,” which represents isolated groups which interact amongst themselves but not with the rest of the network, forming isolated stars. These groups grow one user at a time. Over time they merge with the giant component.


The node analysis of these networks showed that more than half of a social network is outside the giant component where the greatest centrality lies. They used the “control” definition of centrality to determine this. The research also highlighted a prevalence of “stars” in the middle region which are mini social networks, typically driven by one dynamic member who serves as the point of centrality with others serving as satellite nodes – connected to the dynamic member but not to each other. In Kumar, Novak and Tomkins’ analysis the middle region represented one-third of users on Flickr and about ten percent of users on Yahoo! 360.

Also keep in mind that the most growth happens in the middle region where dynamic members influence others to join their network. These sub-networks can gradually join the giant component over time. Once they do, the importance of the dynamic member diminishes. Even if that dynamic member were to leave the network, the others would stay in the network.
So, what is needed is to support the "stars" in their growth so that they become independent of that one dynamic member and are able to continue even without that person.

Wednesday, November 14, 2007

Such a cool way to send a message, thanks B.Dylan!

Tagging in different e-learning environments

In the last days we've had a few discussions about tagging in e-learning environments. My environment, where the tagging takes place, is a portal for learning resources.

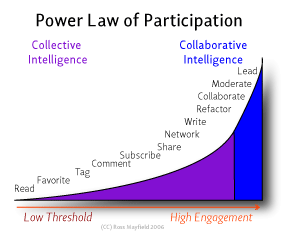
Today I came across this nice graph that displays "power law of participation". Now, haven't looked at the scientific background of it yet, so no comments on that. Anyway, it kinda rang the bell with what I'm doing when looking into levels of user engagement on the portal.

According to this graph, adding things to favourites (e.g. bookmarking) and tagging them represents a pretty low threshold to participate in the activities of that given community.


I'm also looking at leMill environment, which on the other hand, demands a pretty hight level of user engagement, as it is about collaborative authoring of digital learning resources. About a year down with users, there is somewhat little collaborative authoring that actually takes place, Hans told me yesterday.

Maybe tagging in some way could help the participant to take the first steps? well, they can already tag and favourite things in LeMill, so maybe the issue is rather to see if similar levels of engagement appear in that community.

So, along with that, I am interested in looking at the tags in LeMill from the same point of view that I'm doing for tags in our learning resources portal. The difference is that our case is clearly what is called broad folksonomies, whereas leMill should be a rather classical narrow folksonomy. Or is it? Maybe once we start looking at those tags as a triple {user, resource, (tags)} with a timestamp on them, it appears that participants first start by bookmarking and tagging resources from other users, before the user takes a step to create her own resources and finally collaboratively work on other's resources.

Update:

So, some data to back-up was found:


Social Technographics®
Mapping Participation In Activities Forms The Foundation Of A Social Strategy
by Charlene Li
http://www.forrester.com/Research/Document/Excerpt/0,7211,42057,00.html
with Josh Bernoff, Remy Fiorentino, Sarah Glass

This is a document excerpt EXECUTIVE SUMMARY
Many companies approach Social Computing as a list of technologies to be deployed as needed — a blog here, a podcast there — to achieve a marketing goal. But a more coherent approach is to start with your target audience and determine what kind of relationship you want to build with them, based on what they are ready for. Forrester categorizes Social Computing behaviors into a ladder with six levels of participation; we use the term Social Technographics® to describe a population according to its participation in these levels. Brands, Web sites, and any other companies pursuing social technologies should analyze their customers' Social Technographics first and then create a social strategy based on this profile.

Wednesday, November 07, 2007

notes on "Context, (e)Learning, and Knowledge Discovery for Web User Modeling: Common Research Themes and Challenges"

"Context, (e)Learning, and Knowledge Discovery for Web User Modeling: Common Research Themes and Challenges" by B.Berendt

This paper is about context and how to define it or how it is defined differently. The following is related to "Context in Web usage mining and eLearning"

2.1 Context as data and as metadata

"In order to evaluate whether intended and actual usage coincide or not, and in order to obtain a more fine-grained picture of actual usage, it is of course interesting to measure aspects of actual usage. "

- This is also one thing that we are interested to find out in MELT, and partly also in my PhD. As we have very little access to "actual use" we try to infer this type of information from usage logs. E.g. We have a teacher who has said in his profile that he teachers students from 12 to 13 year olds. If he bookmarks LOs that have intended audience of 14-18, we can maybe infer that this LO can also be used for younger students. Especially, if we start seeing this taking place a lot, we might want to update the LOM on intended audience: instead of 14-18 we could say 12-18.

- My interest is also to see if tags can give us any hints of this.


2.2 Context and model parts

"context representations can form and/or enrich (a) user models, (b) material/environment models, or (c) interaction models."

- EUN uses a) in one search to rank resources, but we are still only implementing it and we don't know how users react to it. That is related to my own PhD, as are how different search methods are used. In general, we do way too little with user modeling (I guess bigger issues are still more imminent)


2.3 Context: parameters of the (inter)action

- For my PhD I'm looking into user logs to create "levels of user interaction", e.g. what does it mean if a user views a page vs. makes a bookmark on it. We want to use this as an input for a recommendation system, for example.

- I'm also interested in the type of search that the user has chosen and its relation to the search task that the user has at hand.

- Tags were mentioned in this context, that is also a huge part of what I am looking. There are different questions around them, one most interesting related to search is how they can be used for discovering resources.

Need to look into these papers:

- B. Berendt, G. Stumme, and A. Hotho. Usage mining for and on the semantic web. In H. Kargupta, A. Joshi, K. Sivakumar, and Y. Yesha, editors, Data Mining: Next Generation Challenges and Future Directions, pages 461–480. AAAI/MIT Press, 2004.

- Claus-Peter Klas, Hanne Albrechtsen, Norbert Fuhr, Preben Hansen, Sarantos Kapidakis, L aszl o Kov acs, Sascha Kriewel, Andr as Micsik, Christos Papatheodorou, Giannis Tsakonas, and Elin Jacob. A logging scheme for comparative digital library evaluation. In Julio Gonzalo, Costantino Thanos, M. Felisa Verdejo, and Rafael C. Carrasco, editors, ECDL, volume 4172 of Lecture Notes in Computer Science, pages 267–278. Springer, 2006.

- Totally agree with his observation, not the method: Tanimoto [53] emphasizes that may be difficult to conclude, from a mere clicking event, that there was indeed attention paid to (specific) content of the requested page.


2.4 Context: background knowledge

Tags, tags, tags. multiple views.


2.5 Context: Activity structure
" This metadatum can provide important information about a visitor’s intention or expectation (e.g., whether they followed a prescribed link from a course page, or whether they found a material by actively searching with a very detailed search phrase)."

For me this is important, I guess using terms from this paper, I'm interested in user's intentions and expectations and finding out the ways the users choose to access or discover resources in our portal. I'm also interested in seeing whether one method is more useful to a given task, e.g. if people like browsing to find inspirational material and some other method (social information retrieval vs. information retrieval) for another task. If we know what kind of method is useful for a given task, I think we can help our users a lot.

2.6 example

An example is given using the three aspects of context; activity structure, parameters of the (inter)action and background knowledge. The type of analysis allows answering questions like: which search options are popular and are there differences between users? Which content areas were frequented, and how did people navigate between then; did they go back to the search options, or did they use the inter-content links? Did certain content areas become hugs for navigation and thus served to organise the domain and the presentation of the domain? On the other hand, questions like; were there differences between users with high verbal and users with high visuo-spatial competencies; did certain textual or pictoral material become hub?

These are also questions that I am looking at in lre portal and am getting a good idea of them. However, I have not been able to link them with the task at hand yet, which is something that I'm interested in.

Schooling for Tomorrow scenarios and Science-Fiction

Last autumn I heard a few e-learning keynotes with a heavy science-fiction emphasis. That was wild, I totally loved it. I can not agree more on the idea that working with future scenarios, or science-fiction for that matter, is actually helping the future to come along. It is about helping to shape the future after having peeked in to the future with a positive or a negative outlook. And, I'd like to say that looking or creating scenarios in many perspectives is useful too, as it helps you to see whether this is where you want to end-up or not.

There's been some work going on since the beginning of the millennium regarding scenarios for the future of schooling, we also in EUN worked on that. The OECD report Schooling for Tomorrow, is out too. It's way less exiting than talking about 2048 in a science-fiction scenario, I'm afraid, but still aiming at the same goal - see how technology and network enhanced learning could be used in the days to come.

Of course I picked upon the scenario called "Learning in Networks replacing schools"


This scenario imagines the disappearance of schools per se, replaced by learning networks operating within a highly developed “network society”.

Networks based on diverse cultural, religious and community interests lead to a multitude of diverse formal, non-formal and informal learning settings, with intensive use of ICTs.

How about that for science-fiction?

Well, if it is up to me, I would like to see learning networks in schools even if schools per se are not facing the extinction. You know, before we need to go to a dinosaur museum to see a replica of a teacher.

I don't mind the idea of "networked society", but somehow, when wearing those gray classes, I'm thinking of the efficiency of terrorist cells workings, and how religious and local interest groups could manipulate their own learning interests on me, while at the same time monitoring with whom do I want to learn on the international scale. Yak!

The Schooling for Tomorrow scenarios by OECD are a real tool set for policy-makers, and why not others, to work on. I like practical things like these are. Lately, I've been toying with the idea of making people, who work with education, technology and networks, to write science-fiction short stories of learning in the future. I also think that this would be a very helpful exercise for other PhD students to open up their thinking and not be stuck with what we got now.

How to get started with your own science-fiction story on Schooling for Tomorrow

It's important to understand that it's the journey that is important, not the destination. To say it in other words, I think the whole thinking process to come up with a plot for your story is what counts! Don't worry about picking up the right publisher now ;)

This is what I found out about writing science-fiction, how to get started
  • idea: the premise, the basic thought around which the story will turn
  • a setting: worl for your story to take place in; it can be familiar, or wholly new
  • Characters: two or three, at least, to people your story
  • Aliens: (optional) strange and mysterious beings for your characters to encounter
  • Problem: something your characters want, need, must escape from, etc.
Hmm, I really like to think of Aliens and education...

Next, when you have those sorted out, think about the five dimensional framework from Schooling for Tomorrow. What are:
  • “attitudes, expectations, and political support”,
  • “goals and functions” of education systems
  • “organisations and structures”,
  • the “geo-political aspects”
  • “the teaching force”.
Then, just let it flow!

My own attempt on this is in a wiki. I've already had quite a few engaging and hilarious dinner discussions with my friends about what should the plot be. We never got very far, but it's always been a lot of fun! I only wish we could somehow get the discussion transcripts on the wiki....

Tuesday, November 06, 2007

Notes on "Collaborative tagging and Semiotic Dynamics"

By Gattuto, C., L.Vittorio and L.Pietronero (2006).

Firstly, I must say that I was glad to read this paper. Lately, I've been seeing many papers talking about the properties of folksonomies, like co-occurrence, etc., which have intrigued me quite a lot. This paper explains the process pretty well and underlines an important point - they factor out the users and only deal with streams of tagging events and their statistical properties!

I must admit that this makes the whole area of Semiotic Dynamics less attractive to me. I think it is important to study tags and their properties, but not in isolation from the user. I see (barely) the point to explain tagging activity and the growth of tags in separation from the users. But fair enough.

Problem statement: Uncovering the mechanisms governing the emergence of shared categorisatioins or vocabularies in absence of global coordination is a key problem with significant scientific and technological potential. Collaborative tagging provides a precious opportunity to both analyze the emergence of shared conventions and inspire the design of large agent systems.


Semiotic Dynamics study how populations of humans or agents can establish and share semiotic systems, typically driven by their use in communication. The author argue that the emergence of a folksonomy exhibits dynamical aspects also observed in human languages, such as the crystallisation of naming conventions, competition between terms, takeovers by neologisms, and more.

  • Users interact with a collaborative tagging system by using tags or adding new resources to system
  • Basic unit of information in collaborative tagging systems is a (user, resources, {tags}) triple, which they refer as post in this paper. Tagging event is a tri-partite graph (with partitions corresponding to users, resources and tags, respectively) and can be used as a navigation aid in browsing tagged information
    • Comment: I like the tri-partite graph as navigation aid, yes!, but as the authors mention just above, they don't think of other users and those networks as navigational aid. In contrary, they omit the users just to study the properties, which strikes bizzarre to me.
The authors cite the "rich get richer" model (Yule-Simon's stochastic model) and propose to enhance it with a "fat-tailed memory kernel". This original model is related to the construction of text from scratch:
At each discrete time step one word is appended to the text: with probability p the appended work is a new workd, never occurred before, while with probability 1-p one work is copied from the existing text, choosing it with a proability proportional to its current frequency of occurrence. This simple process ields frequency-rank distribution that display a power öaw tail with exponent alpha = 1-p, lower than the exponent we observe in actual data. This happends because the Yule-Simon process has no notion of "aging", i.e., all positions within the text are regarded as identical ..
This all leads to a model of users' behaviour: the process by which users of a collaborative tagging system associate tags to resources can be regarded as the construction of a "text", build one step at a time by adding "words" (tags) to a text initially comprised of n 0 words. There is also that same Yule-Simon model with long-term memory (about inventing new tags or using existing ones), but recent tags are used more often than old ones.

Also, "in our model,.., the average user is exposed to a few roughly equivalent top-ranked tags and is translated to mathematically into a low -rank cutoff of the power law, i..e., the observed low-rank flattening".

Conclusion: It seems that users of collaborative tagging system share universal behaviour which, despite the intricacies of personal categorisation, tagging procedures and user interactions, appear to follow simple activity pattern.

There is also something about the co-occurrence between high-rank and low-rank tags: it says: "This suggest that high-frequency tags partition - or "categorize" - the resources marked by tags of lower frequency. "
Comment: This all sounds interesting and important, but will need to look into that later.