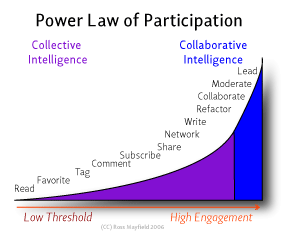
Today I came across this nice graph that displays "power law of participation". Now, haven't looked at the scientific background of it yet, so no comments on that. Anyway, it kinda rang the bell with what I'm doing when looking into levels of user engagement on the portal.
According to this graph, adding things to favourites (e.g. bookmarking) and tagging them represents a pretty low threshold to participate in the activities of that given community.
I'm also looking at leMill environment, which on the other hand, demands a pretty hight level of user engagement, as it is about collaborative authoring of digital learning resources. About a year down with users, there is somewhat little collaborative authoring that actually takes place, Hans told me yesterday.
Maybe tagging in some way could help the participant to take the first steps? well, they can already tag and favourite things in LeMill, so maybe the issue is rather to see if similar levels of engagement appear in that community.
So, along with that, I am interested in looking at the tags in LeMill from the same point of view that I'm doing for tags in our learning resources portal. The difference is that our case is clearly what is called broad folksonomies, whereas leMill should be a rather classical narrow folksonomy. Or is it? Maybe once we start looking at those tags as a triple {user, resource, (tags)} with a timestamp on them, it appears that participants first start by bookmarking and tagging resources from other users, before the user takes a step to create her own resources and finally collaboratively work on other's resources.
Update:
So, some data to back-up was found:

Social Technographics®
Mapping Participation In Activities Forms The Foundation Of A Social Strategy
by Charlene Li
http://www.forrester.com/Research/Document/Excerpt/0,7211,42057,00.html
| This is a document excerpt EXECUTIVE SUMMARY |
| Many companies approach Social Computing as a list of technologies to be deployed as needed — a blog here, a podcast there — to achieve a marketing goal. But a more coherent approach is to start with your target audience and determine what kind of relationship you want to build with them, based on what they are ready for. Forrester categorizes Social Computing behaviors into a ladder with six levels of participation; we use the term Social Technographics® to describe a population according to its participation in these levels. Brands, Web sites, and any other companies pursuing social technologies should analyze their customers' Social Technographics first and then create a social strategy based on this profile. |

2 comments:
Managed to find out about the empirical background for this power law of participation. It seems there is no data behind it, it is based on "feeling things".
However, this has some backing for the data, a report on Social Technographics that surveyed user engagement:
By Ross:
http://ross.typepad.com/blog/2007/04/social_technogr.html
other: http://blogs.forrester.com/charleneli/2007/04/forresters_new_.html
All this is an interesting approach when think on how to foster users engagement and feasible goals. It's like comparing reviews in Connexions to ratings and tags in Connexions and OER Commons or IDEAS. Difficult to research because these data is in the hands of very different repository admins...
Post a Comment